Advanced debugging in iOS


Other day I was watching this excellent Session on Advanced debugging with Xcode and LLDB presented at WWDC-2018. My post may be called as a gist of this talk, since this post summarizes the talk and all the examples mentioned in this post are taken from the Apple's video with slight modifications.
My intention is to use this post as a reference for the future debugging session by having one place to get the list of all tricks I learned from this it. So let's begin!
1. Changing variable values on the fly
I am surprised that I didn't know this trick for a long time. This one lldb trick allows you to change the value of the variable while the program is paused in the debug session. This is essentially important since you can eliminate mock values plus the requirement that you must re-compile and run the code again after this change.
Second advantage is important. Since it may be possible that your
Swiftproject is taking too long to compile and changing variable everytime could be a lot of pain and inefficient in terms of time.
For example, in the code below I have a variable named address1 which has been defined on the top level, and value of streetName property of address1 is set to asd.
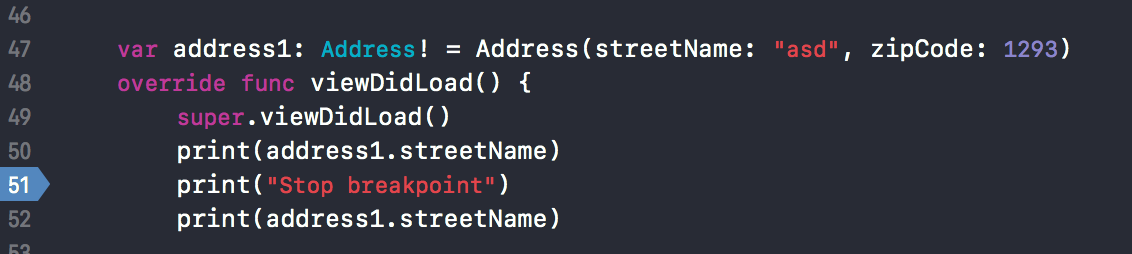
As you must have noticed, I have a print statement on line 50, a breakpoint on 51 and another print statement on line 52.
So line 50 prints asd as expected. I have a breakpoint on line 51 so I stop there and type following command in the debugger,
expression address1 = Address(streetName: "asd1", zipCode: 1293)
This expression assigns a new value to address1 which will persist during the lifetime of this program. So if you continue now, the line 52 will print asd1 as per the new value of address1.
(lldb) po address1.streetName
"asd1"
2. Evaluating an expression with continuing breakpoint
For the demonstration of this feature, I will use the similar example as used in the video. I have a callback implemented using a delegate pattern. However, there is a bug which I uncovered during the debug session. This bug is related to delegate not being properly set up. So let's solve it by adding a breakpoint which,
a. Automatically evaluates a missing expression
b. Continues a program flow without us having to pause at the breakpoint
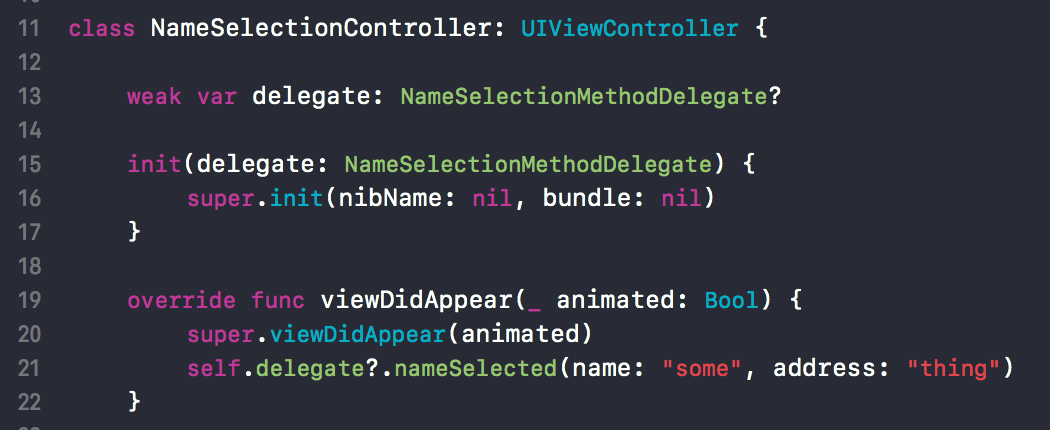
So here lies the bug - I have a controller named NameSelectionController. When view appears completely, we are sending a callback to the calling viewController through the following line,
self.delegate?.nameSelected(name: "some", address: "thing")
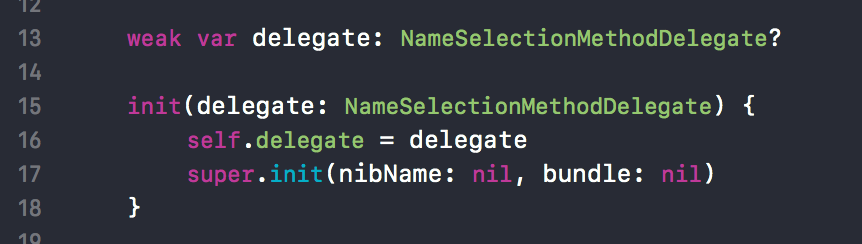
However, as evident from the code on lines 15-17, this delegate is never set up and thus the execution of this line results in the no-op. So I know this delegate needs to be set up in init method by simply adding the following line,
self.delegate = delegate
However, I don't want to do it manually and re-run the code. How awesome would it be if I just add it through lldb magic and first verify if it indeed works?
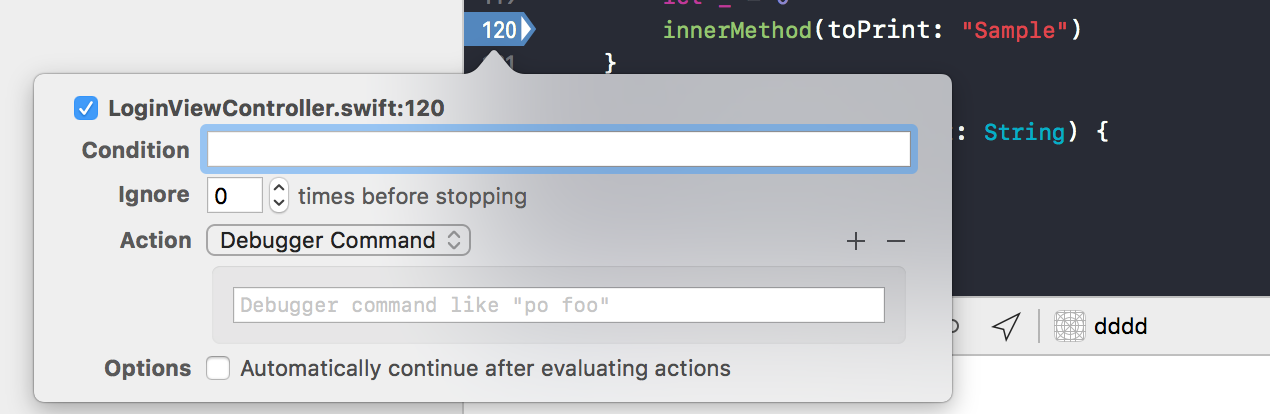
So I am going to add the breakpoint on line 16, double-click on the line, and add action to execute the specific line of code to set up the delegate,
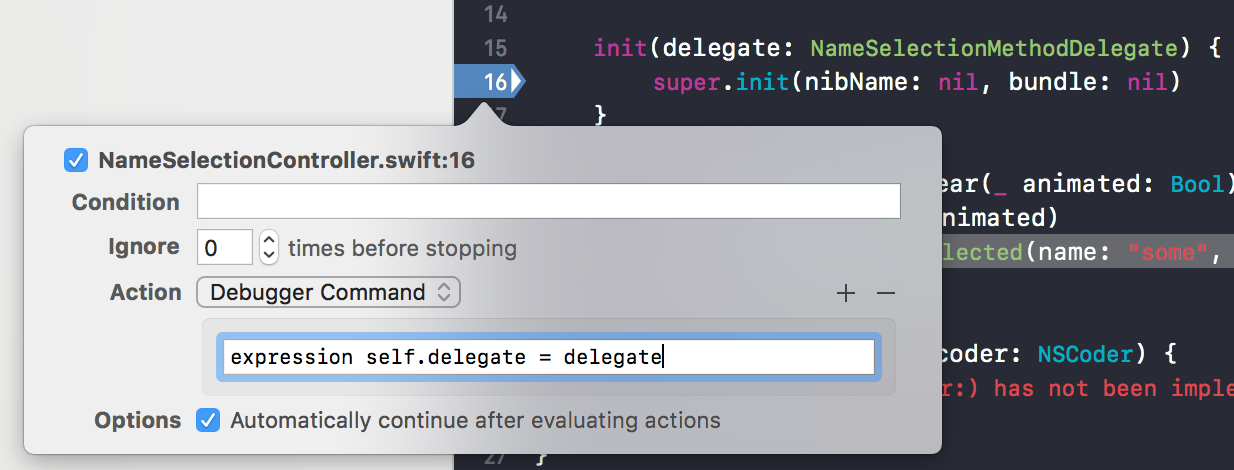
As you saw in the image above, I also checked the option titled as Automatically continue after evaluating actions. This will make sure the expression will be executed at this line and also it won't be paused.
Now, if I hit the NameSelectionController initializer after adding the breakpoint and put another breakpoint in viewDidAppear, I can see that delegate is not nil.
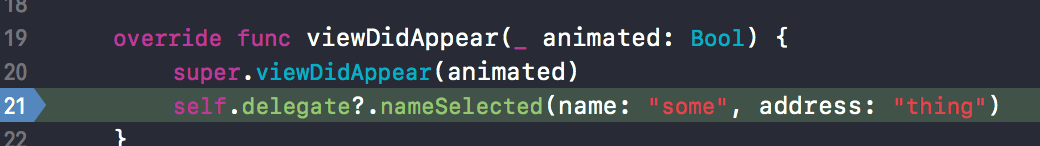
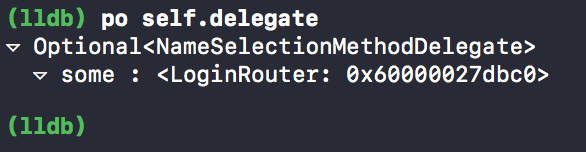
Which is great, cause we just verified our potential fix without having to re-compile the app. Now we know that this line of code when added to the initializer works, we can safely modify the initializer of NameSelectionController to include that line,
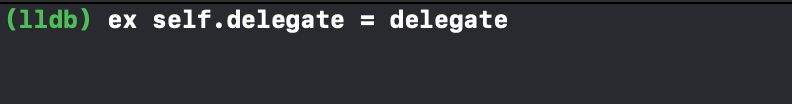
Update: I realized it later that we don't always need to do it this way. We can also open lldb console and simply type
ex <the expression we want to evaluate on the fly>. For example, the set of above steps could be reduced to just one line with the same result inlldbconsole -ex self.delegate = delegate <enter>, and voilà! We have successfully set our delegate tonon-nilvalue
3. Adding breakpoint when the desired method is executed with parameters inspection
Now we will see the demonstration of another trick which allows us to hit the breakpoint and find the source of execution when the given method is executed. We will see this trick with a couple of simple examples,
First, let's say I want to find the places in the code where we are setting the text to the UILabel. However, this could be hidden somewhere in the app, and the problem might seem gigantic when considered a huge project size. So how do we find it? Let's add a breakpoint which will get fired every time any code of the type
label.text = "<some text>"
is executed.
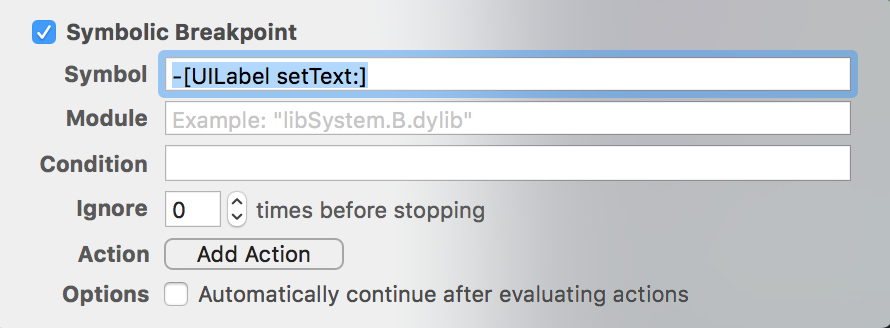
Let's add a symbolic breakpoint with the following signature which will get called every time text is set to the label.
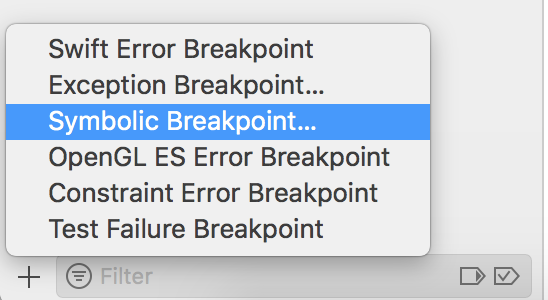
- Add
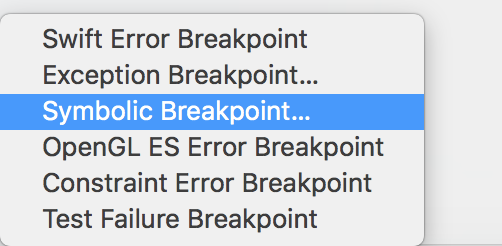
+button at the bottom left of the Xcode sidebar - Choose option which says
symbolic breakpoint
- Under new symbolic breakpoint, add information as shown in the image below,
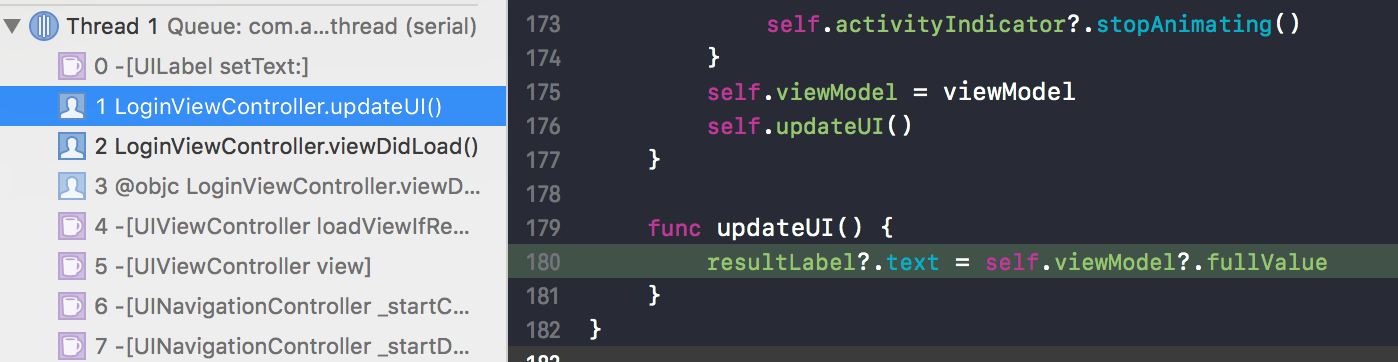
When I start the code, breakpoint pause looks like this,
Let's also look at how assembly code looks like,
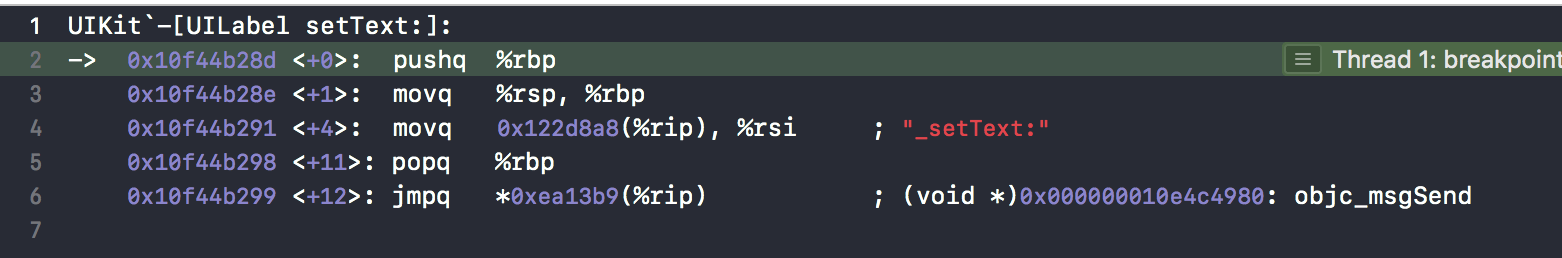
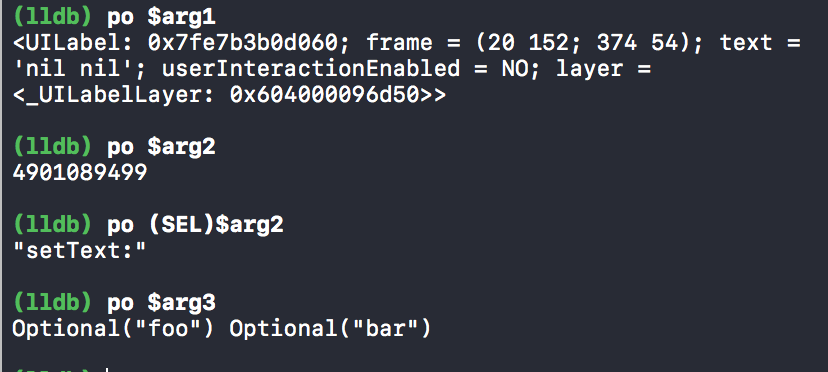
It doesn't make any sense. However, as mentioned in the Apple's presentation, we can easily extract the message receiver, selector and arguments. They are represented by arguments $arg1, $arg2 and $arg3 respectively.
So say, I am paused at the above-mentioned breakpoint, I can easily verify these parameters using following debugger commands,
Please note that I had to cast
arg2toSELsincelldbdoesn't know what kind of type thatargrepresents
Please note that since this code gets called every time
setTextis called onUILabel, this might trigger false positive. Meaning, there could be code in the iOS framework that could trigger this method as well. Especially when it sets the title of the back button on the navigation bar
Let's take a look at another example that triggers this symbolic breakpoint. Let's say we want to trigger the breakpoint when any ViewController is pushed on the navigation stack. Let's add a symbolic breakpoint like the previous example,
And also add extra information that will help us trigger this breakpoint when the mentioned condition is met,
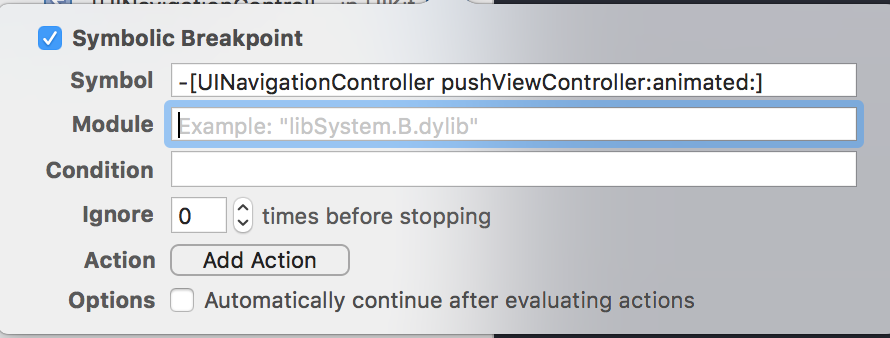
Please note how symbol follows the Objective-C pattern. Since it's evident that
lldbevaluates these expressions from Obj-C representations, we need to provide method signatures which match with the Objective-C format
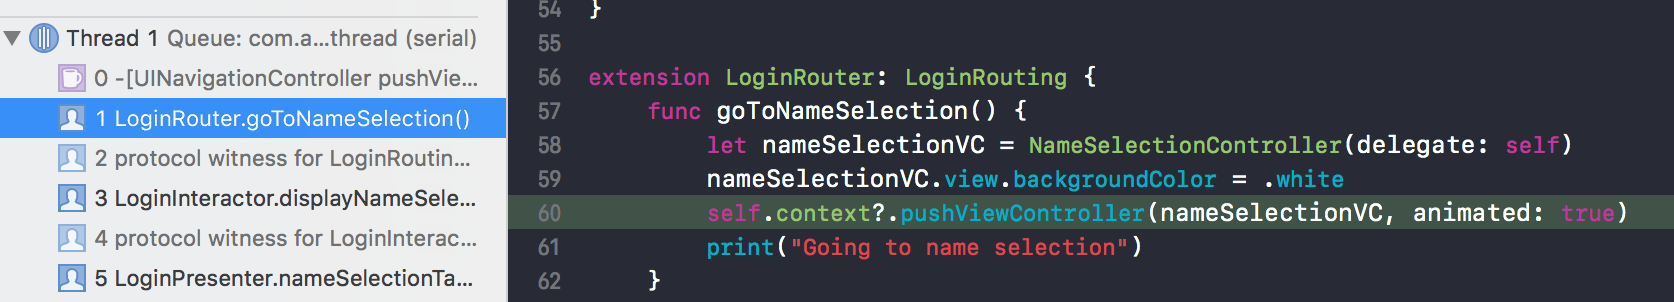
Now let's see what happens when we push the viewController on navigation stack. This breakpoint gets triggered and we get action like this,
It's not that interesting. Let's look at the assembly code and try to extract metadata about this call like we did before,
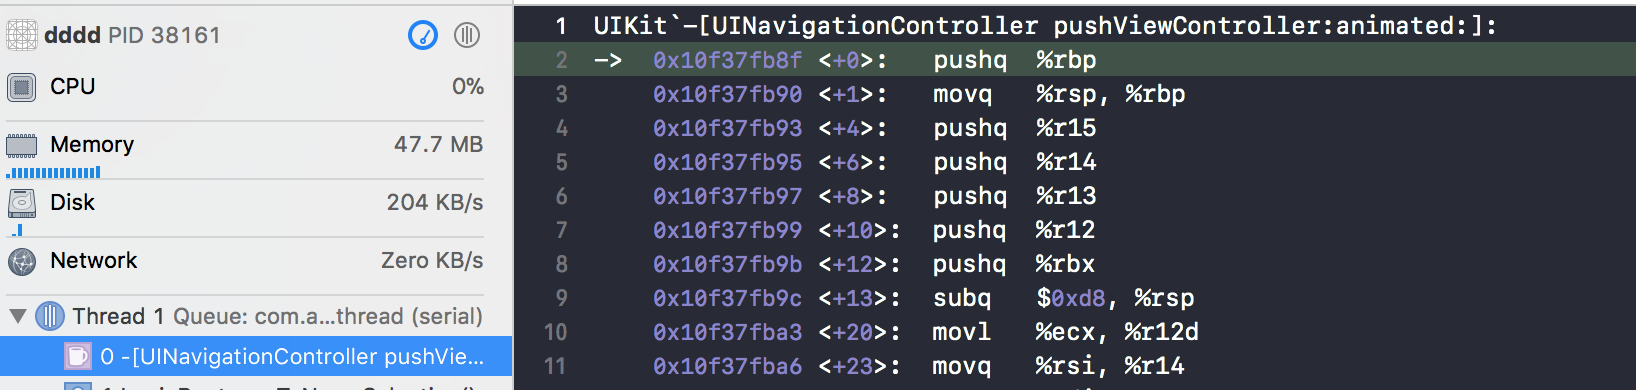
This is complete garbage. Let's use the technique we used before to extract individual selector and arguments out of this assembly code,
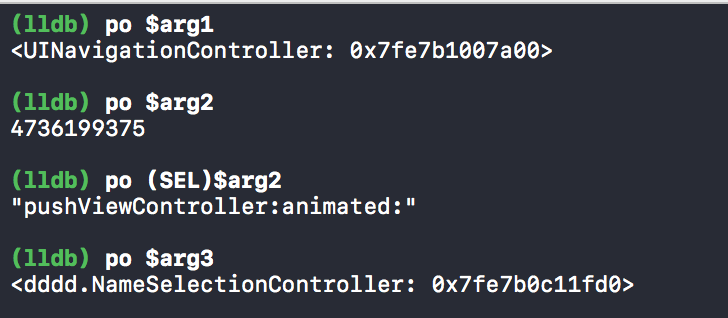
Great! So based on the information provided by lldb we got the following information back along with their respective addresses
- Message receiver -
UINavigationController - Selector -
pushViewController:animated: - Argument -
NameSelectionController
This is a really great trick. If you know how you selector and message receiver looks like, you can easily get the location of any method call you want. Just caveat is that if you add a breakpoint for frequently used methods (Yourself plus by the iOS internals), you can get those calls multiple times which could be frustrating. So discretion while adding these kinds of breakpoints is necessary
4. Skipping line of code to execute - Moving the Instruction Pointer
Frankly, I never knew about this thing Instruction Pointer on iOS and its meaning in the lldb context. In fact, it allows you to change the execution flow or even execute the same instruction again and again. Let's look at the example,
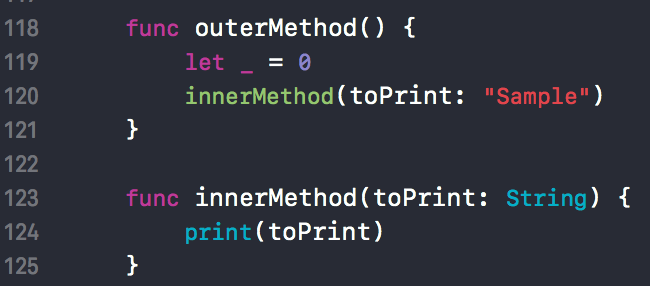
Let's assume we have these two methods named outerMethod and innerMethod. The latter takes the parameter named toPrint and prints it in the console.
func outerMethod() {
    let val = 0
    innerMethod(toPrint: "Sample")
}

func innerMethod(toPrint: String) {
    print(toPrint)
}
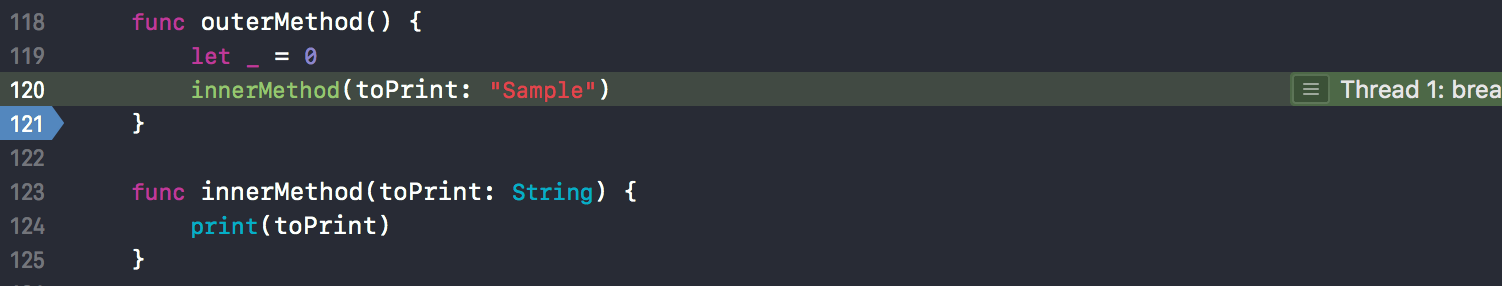
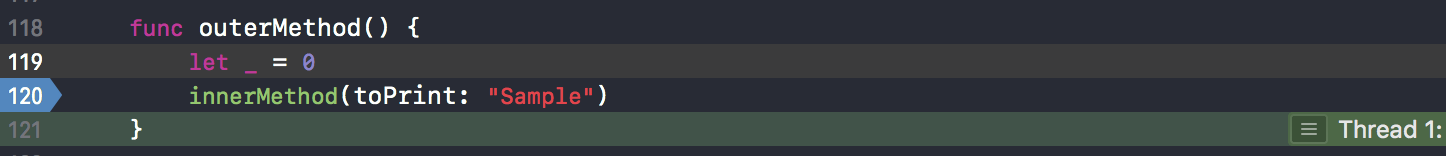
Let's see how it can be used to call the same method repeatedly without having to compile the programme every time. First, we will call outerMethod and put the breakpoint on the line 121 as shown in the image.
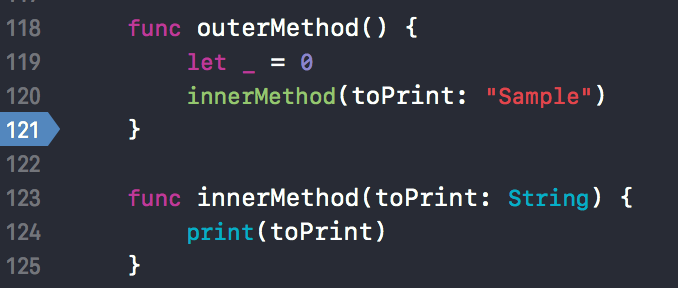
When outerMethod is called for the first time, it calls innerMethod: toPrint and prints Sample on the console. Now as breakpoint dictates, we are paused on line 121.
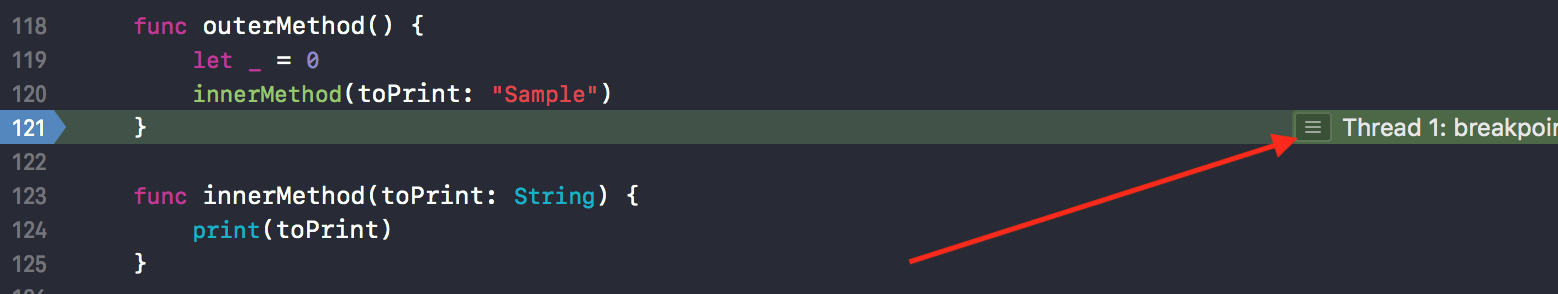
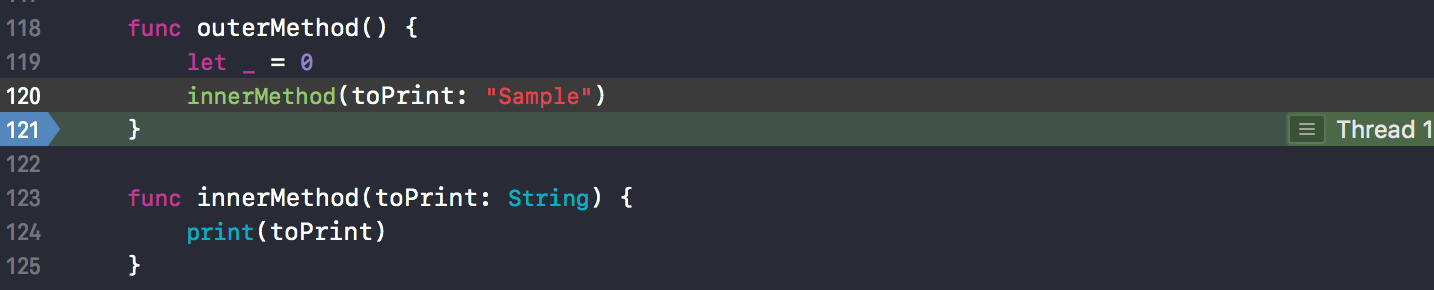
Now, say we want to call the innerMethod: toPrint again. (In the current session, without re-running the code). As you see in the image as pointed by arrow there is this three line hamburger icon. This is called an Instruction Pointer and it points to the next line of code to be executed.
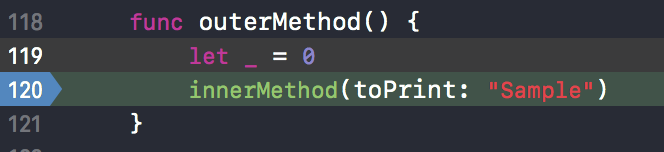
By default, it points to the next line. But if we want to alter the flow, we can always move this pointer somewhere else and control the execution flow. In this example I want to call innerMethod:toPrint multiple times, so I will just move this pointer to the top of outerMethod which will result in calling innerMethod one more time and stopping on the line 121. To move the Instruction Pointer, just click on Hamburger icon on the right and drag it to the desired location,
Now, if we continue the execution it will print Sample one more time, or as many times as we want,
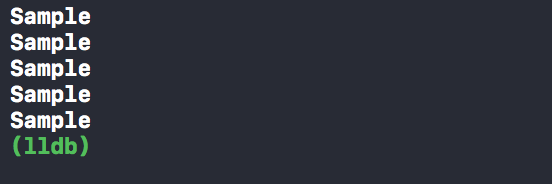
As you can see from above screenshot that I have executed this code total 5 times which resulted in printing "Sample" total 5 times.
Another opposite trick you can do it to avoid the line of code from executing.
Suppose, for some debugging reason I don't want to execute the line of code innerMethod with given parameters, but instead want to call it with other value. It can be done by,
- Pausing the flow at the line which we want to avoid from execution
- Calling this method with alternate parameter through debugger with expression,
expression innerMethod(toPrint: "algo")
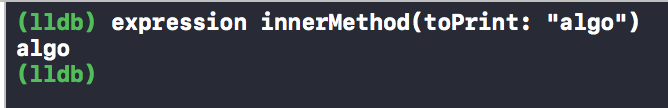
- Moving the instruction pointer to the next line and finish the execution. After finishing the execution you will see that it has printed
Even better, this can be done quite easily as depicted in Apple's video. We can add a symbolic breakpoint to,
- Skip the line of code we don't want to execute
- Add the alternative expression to execute in place of the existing logic
- Continue the program flow without pausing
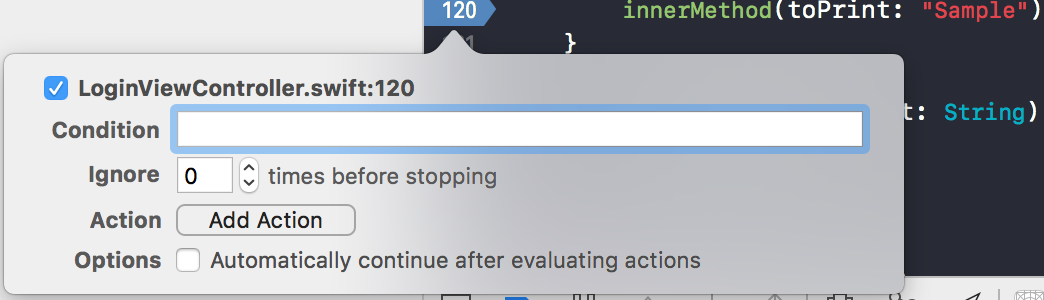
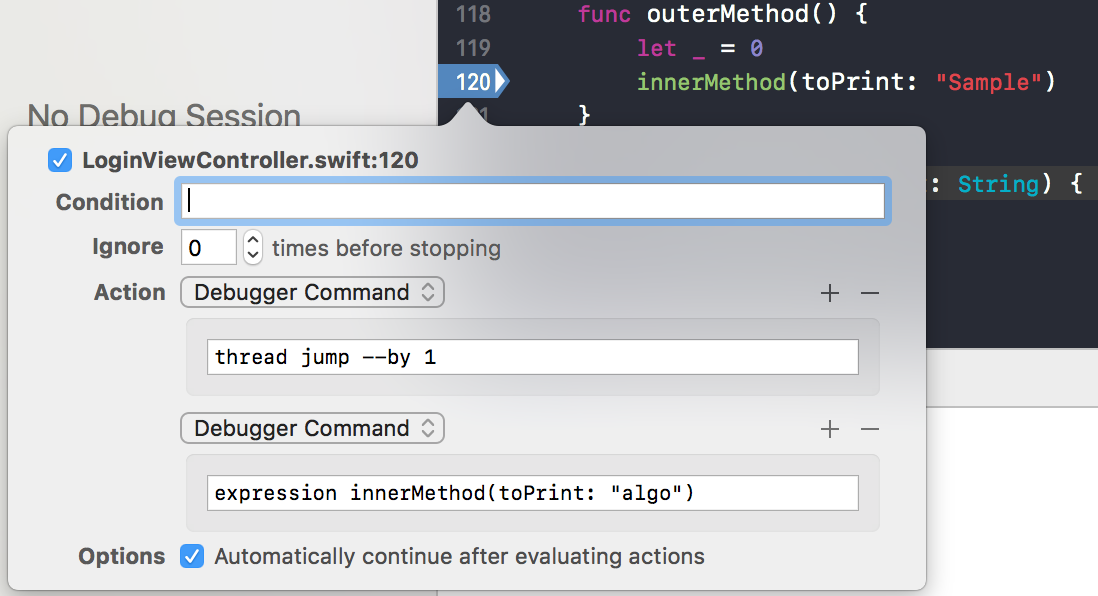
In order to do that, let's add a breakpoint on line 120. Right-click it and choose Edit Breakpoint. You will see dialogue as follows,
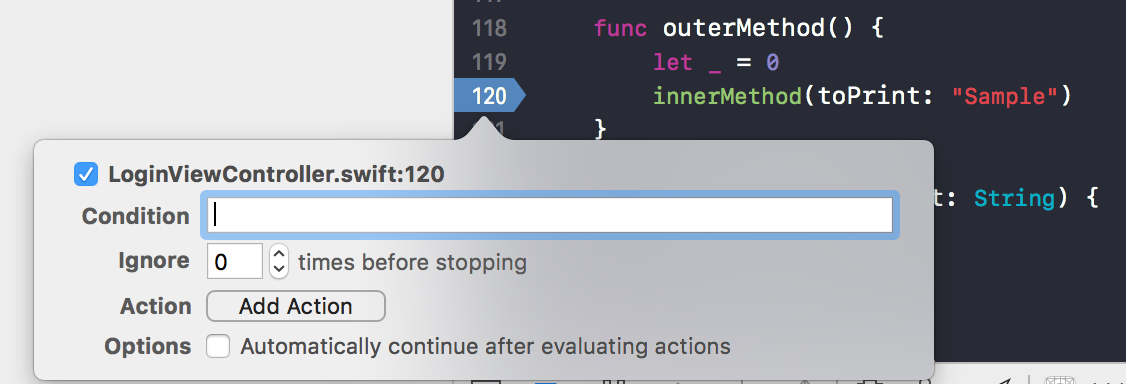
Now click the Add Action option to see the action for Debugger Command,
Under the "Debugger command", input following code to skip the line at which program is currently paused,
thread jump --by 1
While we are skipping, we also want to provide alternative code to execute as a requirement. Thus, we add one more Debugger Command to execute by tapping the Add Action button and add the following line of code, which is also the expression we want to execute
expression innerMethod(toPrint: "algo")
When these two commands execute, we also don't want to pause in the debugger. Thus we check the option which says Automatically continue after evaluating actions. The whole setup looks like this after full automation,
Thus if you run the code again and this is the only symbolic breakpoint you have, you can see console prints algo without stopping or pausing the program execution.
5. Adding the conditional execution
Another magic that we can do with symbolic breakpoints is that we can add the condition that will evaluate another expression of changing the state if that condition is evaluated to be true while the program is running. This will also help us debug the code without actually having to make the change and re-running it multiple times.
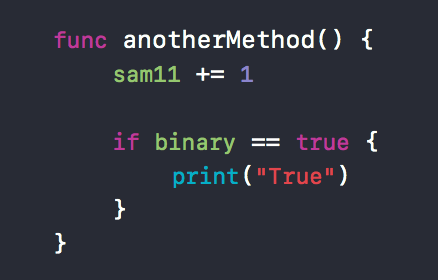
Suppose I have the following method named anotherMethod.
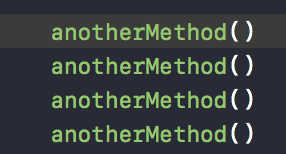
And we are calling it 4 times in a row, from somewhere else in this file,
You can safely assume that variables
sam11andbinaryare defined at the top level of file
Now, say in method anotherMethod(), (Although we don't have that logic yet) we want to execute the line print("True") when the value of sam11 is greater than 2 and also continue the program execution.
In order to achieve that, we will add a conditional breakpoint to change the value of binary to true when sam11 > 2 on the fly and hopefully that will print True in the console.
We will add another symbolic breakpoint in our program execution,
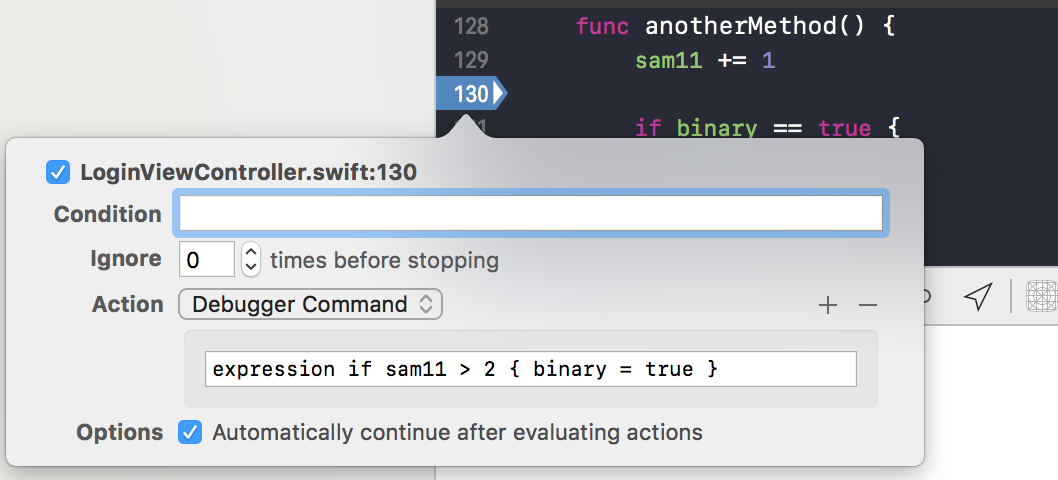
Since the initial value of
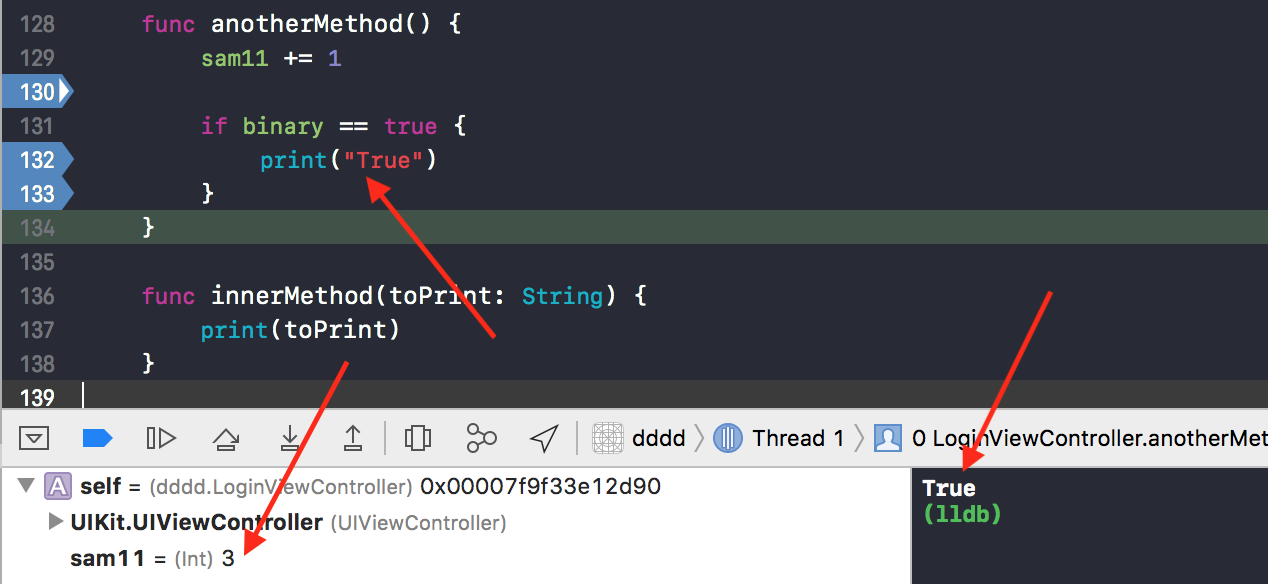
sam11is 0 and we're callinganotherMethod4 times, at some point of time,sam11 > 2will be true and it will printTruein the console.
In order to do that, let's run the code, execute anotherMethod 4 times in a row and see ourselves that it eventually prints True in the console.
6. Executing Swift code in Objective-C context
There might be some useful Objective-C APIs which may not be available in Swift. However, until this point, I didn't know a way to use a Swift variable and execute a method in Objective-C context. However, this is possible in lldb with one hidden trick.
Suppose I want to find the recursiveDescription of a given view. In Objective-C, there is a really good API where you can just call [UIView recursiveDescription] to get this info.
However, making a call like this from Swift is not possible. Even using square bracket notation won't be allowed. For example, if I call recursiveDescription from viewDidLoad, this will be produced as an error.
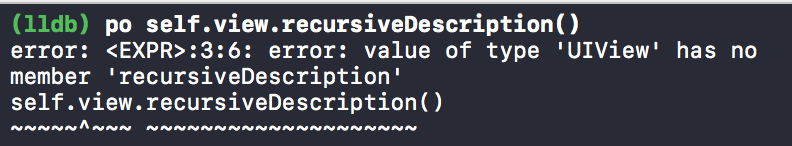
How can we fix this?
We can always ask the debugger to evaluate certain commands in Objective-C context by specifying some parameters and expressions. This will use the variables from Swift space, but will still execute them in the Objective-C space. Such as,
expression -l objc -O -- [`self.view` recursiveDescription]
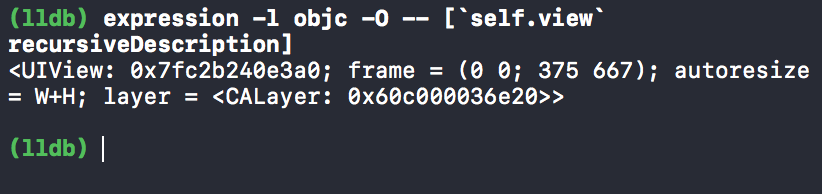
(lldb) expression -l objc -O -- [`self.view` recursiveDescription]
<UIView: 0x7fc2b240e3a0; frame = (0 0; 375 667); autoresize = W+H; layer = <CALayer: 0x60c000036e20>>
Please note the use of backticks ` in the above expression. When we execute this command in Objective-C, it is executed in Objective-C's frame. That frame, however, doesn't know what does it mean by
self.viewso you will see an error in the console. When you enclose something in the backticks, that expression is evaluated in the current frame (In this case,Swift) and rest of the expression is invoked in the Objective-C context
7. Adding aliases
lldb commands could sometimes be lengthy and awkward to remember. Thus we have a feature that can make our lives much better. This is called aliases. As you saw in the previous example,
(lldb) expression -l objc -O -- [`self.view` recursiveDescription]
The expression is quite long and difficult to memorize. So let's make an alias called poc for it as follows,
(lldb) command alias poc expression -l objc -O --
Now every time we have to type in expression -l objc -O --, we can simply use poc instead. So previous command can be reduced to the shortened version,
(lldb) poc [`self.view` recursiveDescription]
<UIView: 0x7fc2b240e3a0; frame = (0 0; 375 667); autoresize = W+H; layer = <CALayer: 0x60c000036e20>>
Remember that we have used new alias poc to write down this long command. For further examples, we will be using this alias version.
8. Printing object description using memory address
Usually, iOS developers will use the command of the form po <expression> in order to print the description of the underlying object. Here, however as seen in the previous example, if we try to print the description of the object using the memory address, we will get an obscure number,
(lldb) po 0x7fc2b240e3a0
140474190980000
This is because unlike Objective-C, Swift does not treat numbers as pointers and thus does not dereference to convert them to object description
We can easily solve this problem by printing the memory object description in Objective-C frame as we did before,
(lldb) expression -l objc -O -- 0x7fc2b240e3a0
<UIView: 0x7fc2b240e3a0; frame = (0 0; 375 667); autoresize = W+H; layer = <CALayer: 0x60c000036e20>>

(lldb) poc 0x7fc2b240e3a0
<UIView: 0x7fc2b240e3a0; frame = (0 0; 375 667); autoresize = W+H; layer = <CALayer: 0x60c000036e20>>
And it works great!
Fortunately, there is more. In Swift, there is another function to print the description of the object from memory address. That is to use unsafeBitCast.
This function takes two arguments,
- Address of the object
- Type of the underlying object under investigation
It is up to the user to provide correct type while calling this function.
Referring to the above example, if we want to print the description of an object corresponding to the address 0x7fc2b240e3a0 and type UIView, we will do it with following command,
(lldb) po unsafeBitCast(0x7fc2b240e3a0, to: UIView.self)
<UIView: 0x7fc2b240e3a0; frame = (0 0; 375 667); autoresize = W+H; layer = <CALayer: 0x60c000036e20>>
And we get the output same as the previous command gave us by executing in the Objective-C frame
9. Inspecting and updating UIView instances on the fly
Another magic we can do with lldb commands is to inspect view frame with position and size in the debugger and changing their position and sizes while the code is paused waiting for further actions.
Let's start with seemingly innocuous UILabel instance with default title foo bar.
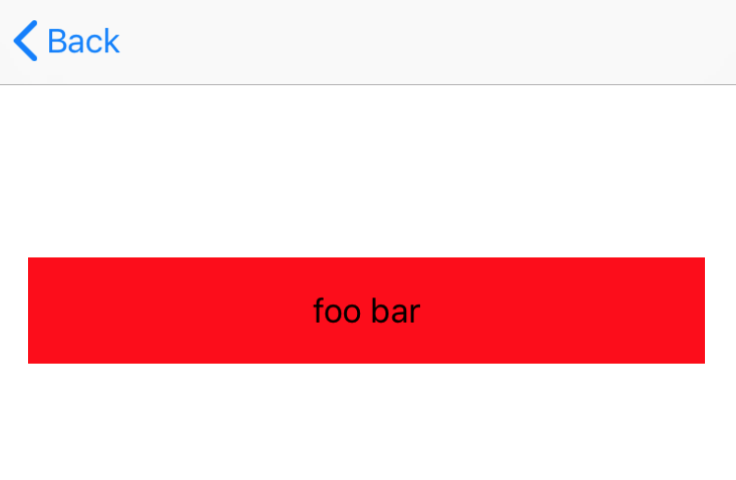
Suppose we want to play with it a little bit modifying its color, position, and size. First, we need to get its memory address,
(lldb) po resultLabel?.description
▿ Optional<String>
  - some : "<UILabel: 0x7fe04cc03de0; frame = (16 152; 343 54); text = \'foo bar\'; userInteractionEnabled = NO; layer = <_UILabelLayer: 0x60c00008fb40>>"
This was our first job, to get an actual memory address. Now we have it, plus the object type and let's call unsafeBitCast with these arguments,
(lldb) po unsafeBitCast(0x7fe04cc03de0, to: UILabel.self)
<UILabel: 0x7fe04cc03de0; frame = (16 152; 343 54); text = 'foo bar'; userInteractionEnabled = NO; layer = <_UILabelLayer: 0x60c00008fb40>>
Since unsafeBitCast returns an actual object under inspection, we can print some of its properties, including position, color and size
(lldb) po unsafeBitCast(0x7fe04cc03de0, to: UILabel.self).frame.size
▿ (343.0, 54.0)
  - width : 343.0
  - height : 54.0

(lldb) po unsafeBitCast(0x7fe04cc03de0, to: UILabel.self).frame.origin
▿ (16.0, 152.0)
  - x : 16.0
  - y : 152.0

(lldb) po unsafeBitCast(0x7fe04cc03de0, to: UILabel.self).backgroundColor?.description
▿ Optional<String>
  - some : "UIExtendedSRGBColorSpace 1 0 0 1"
This is great! Now let's modify these properties for the label. In short, we will,
- Reduce the width of a label
- Move label little bit up
- Change the background color to
green
(lldb) po resultLabel?.description
▿ Optional<String>
  - some : "<UILabel: 0x7fe04cc03de0; frame = (87.5 74; 200 44); text = \'foo bar\'; userInteractionEnabled = NO; layer = <_UILabelLayer: 0x60c00008fb40>>"

(lldb) po unsafeBitCast(0x7fe04cc03de0, to: UILabel.self).backgroundColor = .green

(lldb) po unsafeBitCast(0x7fe04cc03de0, to: UILabel.self).frame.size = CGSize(width: 200, height: 44)

(lldb) po unsafeBitCast(0x7fe04cc03de0, to: UILabel.self).frame.origin.y = 74

(lldb) po unsafeBitCast(0x7fe04cc03de0, to: UILabel.self).frame.origin.x = 87.5
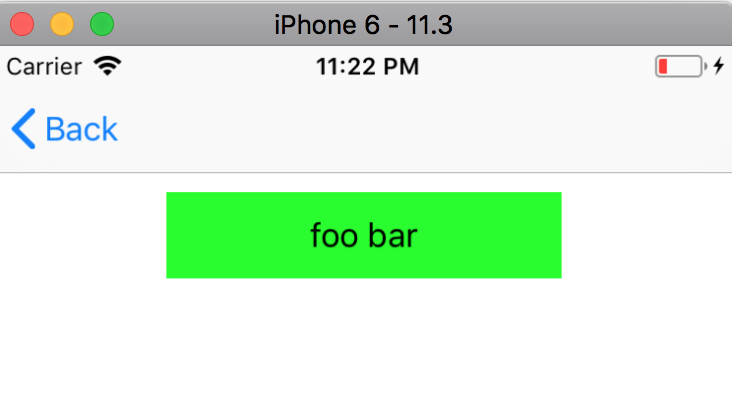
Let's look at our simulator now,

Hmmm...No change. Why? This is because we are currently paused in the debugger, that's why Core Animation is not applying any changes to screen's buffer. In order to force Core Animation to apply those changes to screen's buffer immediately, we need to explicitly ask them to do it by running the following command,
(lldb) expression CATransaction.flush()
And Voila! All our changes are now applied,
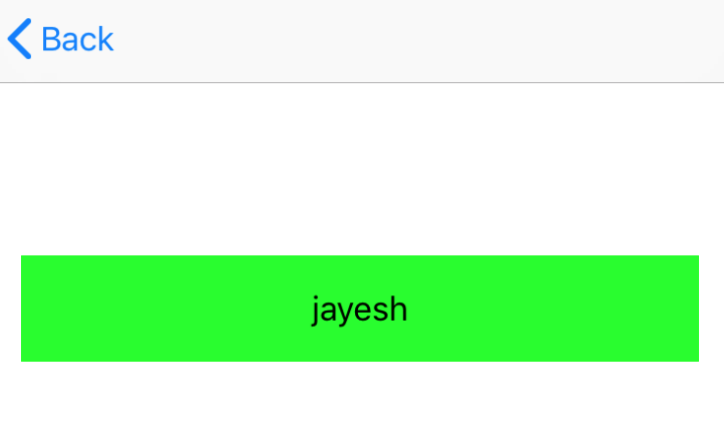
In the similar manner you can also change the text too,
(lldb) po unsafeBitCast(0x7fe04cc03de0, to: UILabel.self).text = "jayesh"
(lldb) expression CATransaction.flush()
10. Returning early from method
If you're debugging your code and if you wish to immediately exit it without causing any more side-effects in the method, lldb offers another trick to return early as soon as you invoke this command.
For example,
func getNumber() -> Int {
    print(100)
    return 100
}
And I want to exit this function as soon as 100 is printed.
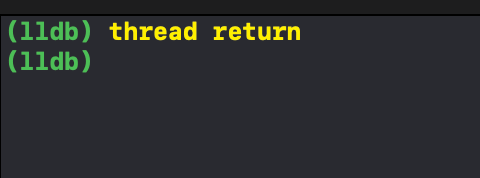
Simply put breakpoint on line which prints 100, stop there and print thread return in lldb console. Program control will immediately return out of that function.
Running thread return in lldb console while stopped at breakpoint
since program exited early, the return value will contain garbage. In my case, I got
4546749056assigned to int variable which was expecting return value from method. (In case of string, it's corrupted pointer and in case of double/float, it's 0 if you exit early)
11. Difference between p and po command
If you're developing an application and want to inspect a class or a struct. A standard way to inspect content of the class would be typing p <class_instance> or po <class_instance> to analyze it during the debug session. But what's the different between these two?
Let's look at the example by defining a simple class House with two properties,
class House: CustomDebugStringConvertible {
    let number: Int
    let streetAddress: String

    init(number: Int, streetAddress: String) {
        self.number = number
        self.streetAddress = streetAddress
    }

    var debugDescription: String {
        return "House number is \(self.number)"
    }
}

...
...

let house = House(number: 100, streetAddress: "Walnut Hill")
In order to make debugging easier, we have also conformed this class to
CustomDebugStringConvertibleprotocol and implementeddebugDescriptionas expected by this protocol conformance. ImplementingdebugDescriptionallows us to get an extended debug description of the object
If you pause the debugger and print po house, it will print following in the debug console,
House number is 100
Which is controlled by the text we provide in the debugDescription.
On the contrary, if you run p house, it will output the follwing text,
(Practice2021.House) $R2 = 0x00007b0c00067c20 (number = 100, streetAddress = "Walnut Hill")
p uses lldb's built-in formatters to format the object description. po command allows us to override that behavior the way we want. The advantage of p is, it shows,
- Full qualified class name
- Instance memory address
- Description of all the properties
Which allows you to take advantage of existing lldb formatter instead of creating your own
And this is all we have today. My big thanks to the Apple's advanced debugging session without which this blog post would not have been possible. Hope this helps and if you have any other tips to share, I will be more than happy to hear them from you
References:
Advanced Debugging with Xcode and LLDB