Advanced Breakpoint Improvements in Xcode 13 (WWDC 2021)


At WWDC21, Apple announced various new breakpoint improvements into Xcode 13. In this post, I will go over them and demonstrate how they can benefit your workflow.
Previously, setting up breakpoints triggered them where they were not supposed to get triggered or it took a lot of work to work around them. In other cases, the breakpoint didn't trigger and developers didn't know why. Other times, runtime issues were overlooked because there was no built-in support that would pause the flow whenever the app ran into these issues. Xcode 13 solves these problems by introducing the following new features.
- Column Breakpoints
- Support to Inspect Anonymous Closure Parameters
- Attaching Symbolic Breakpoints to a Specific Module
- Fixing Unresolved Breakpoints
- Enabling Runtime Issues Breakpoint
We will go over them one by one with examples and see how you can leverage them to efficiently debug your apps.
Column Breakpoints
One of the exciting new debugging features in Xcode 13 is granular breakpoint support. Previously, developers could only set a line-level breakpoint and it was ok for the most part. But if you have long code paths on the same line that involve other functions or closures, things would become complicated.
The problem with other code paths is, if you want to dig into a code path situated at the end of the line, you would need to successively step in and step out of existing functions, and code paths which would consume a lot of time.
Suppose we have the following code,
extension Int {
    func doubleTheValue() -> Int {
        return self * 2
    }

    func addRandomValue() -> Int {
        let randomValue = Int.random(in: 1...10)
        return self + randomValue
    }
}

class MyClass: UIViewController {

    var originalValue: Int {
        let randomValue = Int.random(in: 1...10)
        return randomValue
    }

    func init() {
        let output = originalValue.doubleTheValue().addRandomValue()
        print(output)
    }
}
What it does in the initializer, it generates a random value inside closure, assigns it to originalValue variable, successively calls the utility methods that doubles that value and adds a random value to the previously passed integer.
We already have an extension on the type Int that contains utility methods to double and add random value to passed value. Now, in the current situation, if I want to debug what's going on inside the addRandomValue function, I need to step in and step out of closure that generated the random value for orignalValue variable as well as inside the function that doubles the value.
But this is time-consuming and probably won't sit well if I have a long chain of functions that pass values to the next functions.
Column Breakpoint at the Rescue
The newly introduced column breakpoint feature helps us remove this redundant step-in and step-out dance during debugging. With column breakpoints, you can add a breakpoint at the same function where you want the debugger to pause and then you can directly step inside that function.
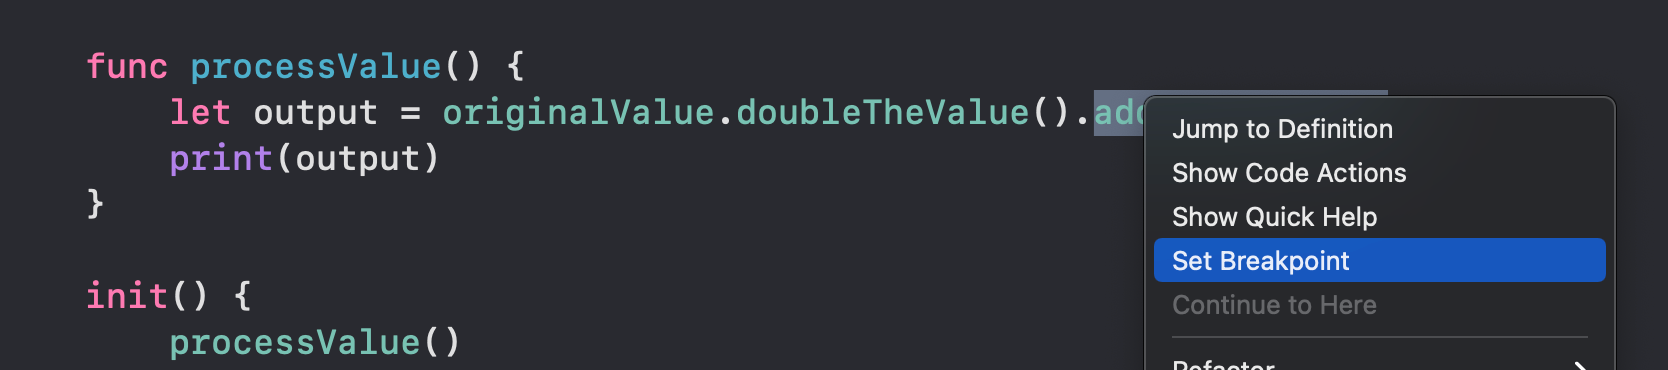
For example, if I want the debugger to pause at addRandomValue, I will select, right-click on it and choose Set Breakpoint options to set a line breakpoint at that method. Next time the control reaches that point, it will highlight that line and column number at which the debugger has paused so that I can directly step into my desired function.
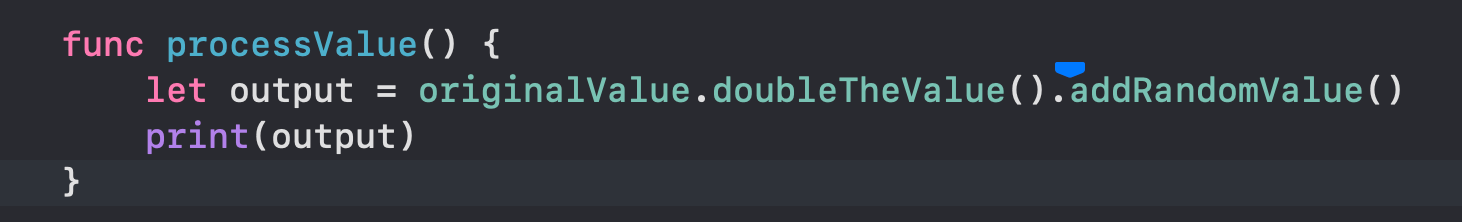
Selecting Column Breakpoint
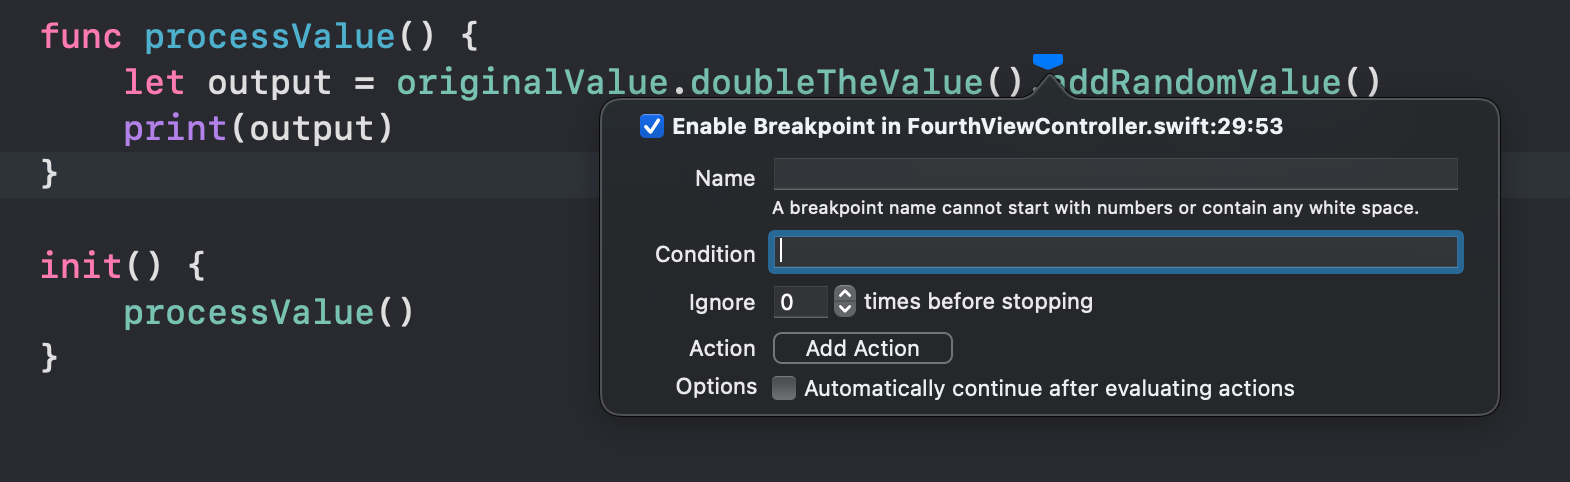
Editing the Column Breakpoint
You can also edit the column breakpoint by double-clicking it.
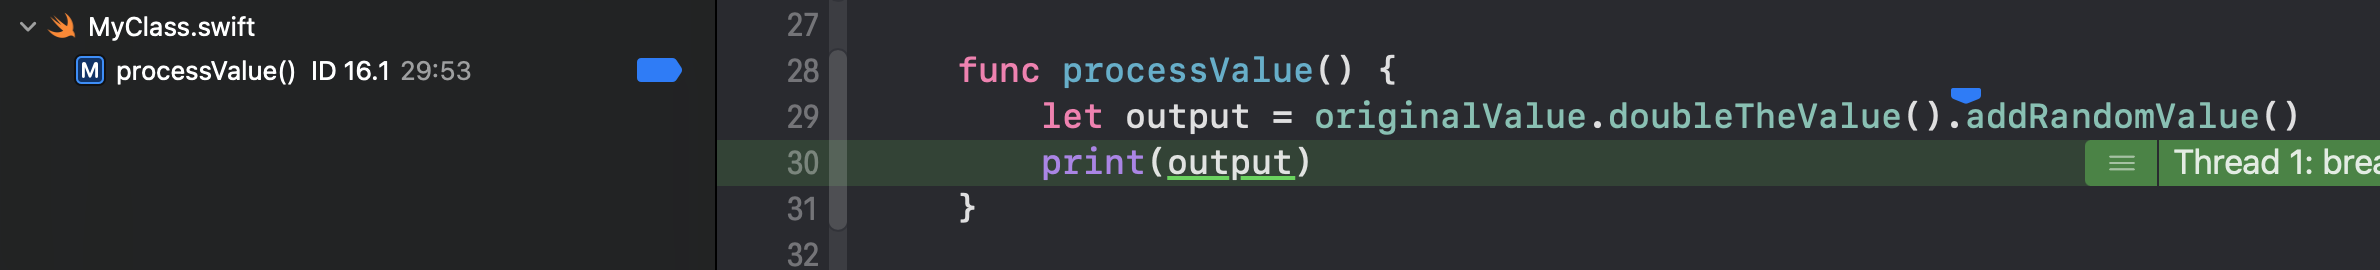
Debugger paused and showing line and column number of paused location
I really like this feature. I know in the past when I had to debug similar code, my usual approach was to step in and step out of the long chain of functions that I didn't need myself to bother with. With column breakpoints, I can now only focus on part of the code that I am interested in.
Support to Inspect Anonymous Closure Parameters
There is one more place where column breakpoints shine. Place where developers need to inspect anonymous closure parameters. Let's take a look at the next example,
let inputArray = [1, 2, 3, 4, 5, 6, 7, 8]
let outputArray = inputArray.compactMap { $0 }.filter { $0 % 2 == 0 }.map { String($0) }
If I want to inspect what's going on inside the last map without column breakpoint, we again need to step in and out of previous closures. To solve the problem, let's put a column breakpoint at the last closure and see how it stops at that precise location and shows the value of a variable in that instant of time,
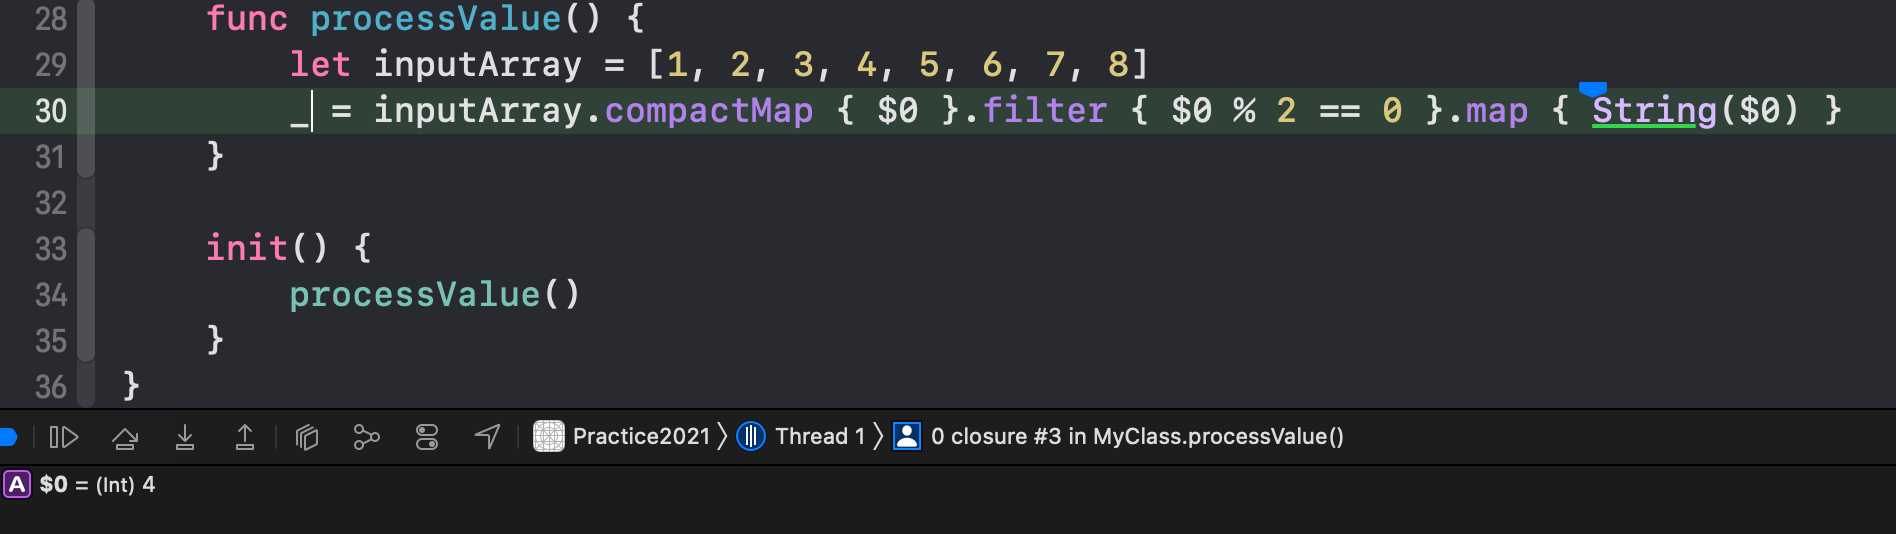
This may not seem like a useful feature due to a simple example, but imagine a case where you're applying multiple transformations with complex closures. The ability to inspect on a closure by closure basis using column breakpoints provides much utility in that case.
Attaching Symbolic Breakpoints to a Specific Module
Symbolic breakpoints allow the debugger to stop at a given function. However, if the function name matches with functions in other modules, it will end up applying breakpoint to other functions too which have the same name but are present in different modules.
A new feature allows you to specify module name in addition to symbol name where symbolic breakpoint must be applied.
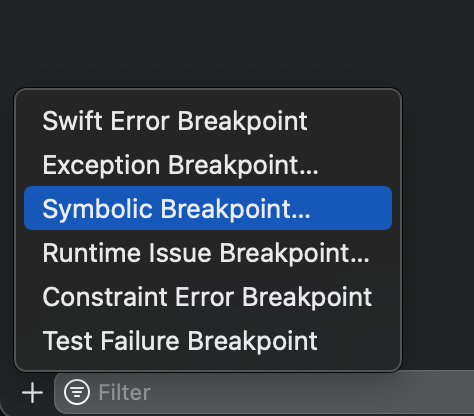
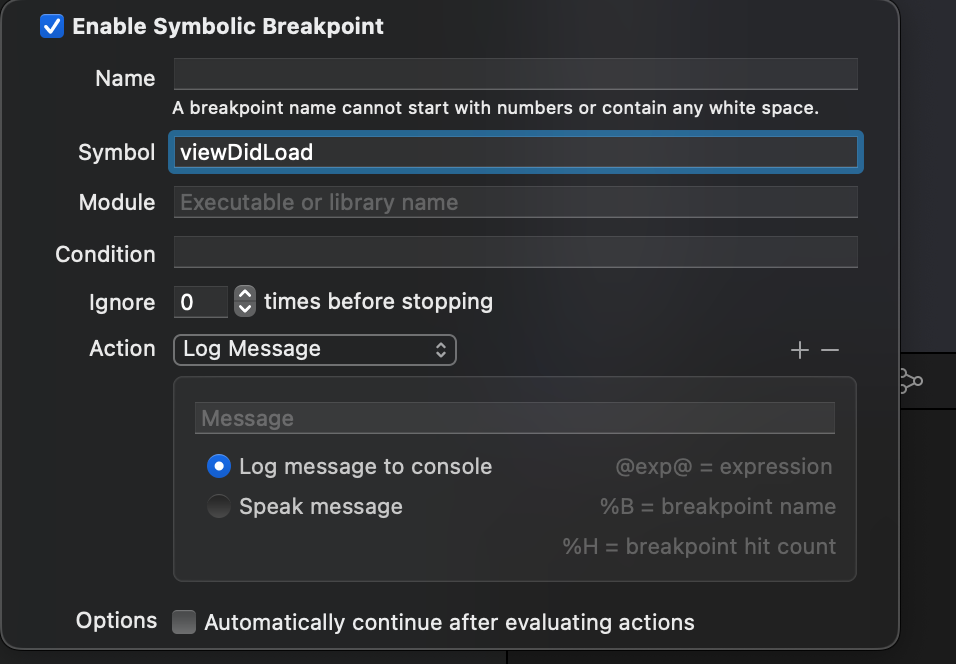
Let's say, I want to apply breakpoint in viewDidLoad method. So I click in Xcode's bottom-left corner on + symbol, choose the symbolic breakpoint option, and input viewDidLoad as a symbol name.
Since viewDidLoad method exists in other modules too, including System modules, it creates a breakpoint that is applicable to all those places and gives a long list of all the symbolic breakpoints. As you can see, the list is quite long,
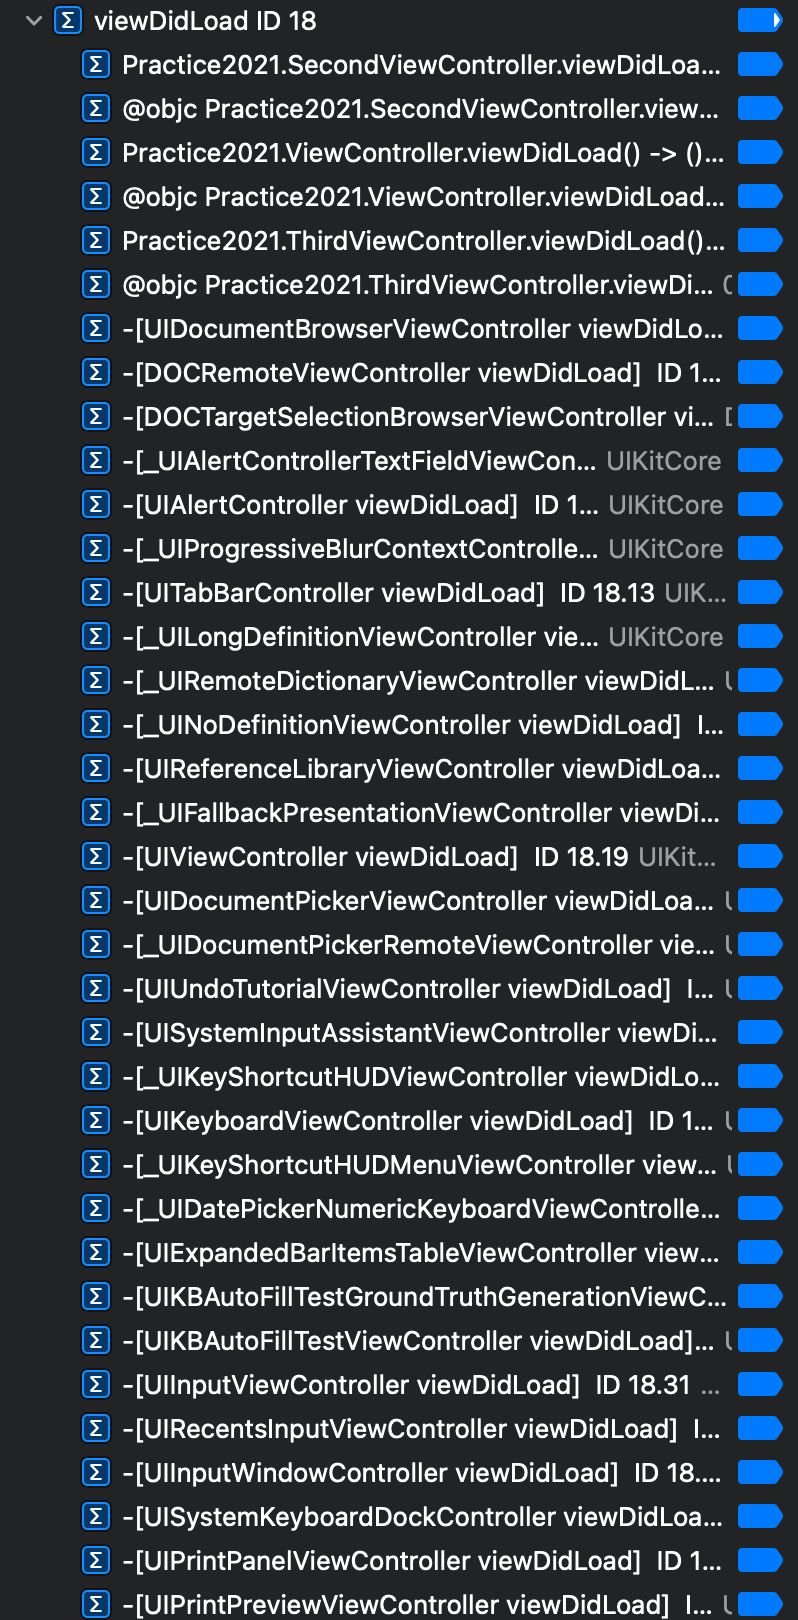
As you can see, this list is long, complicated, and unnecessary. We only want to add a symbolic breakpoint in viewDidLoad method present in our current module.
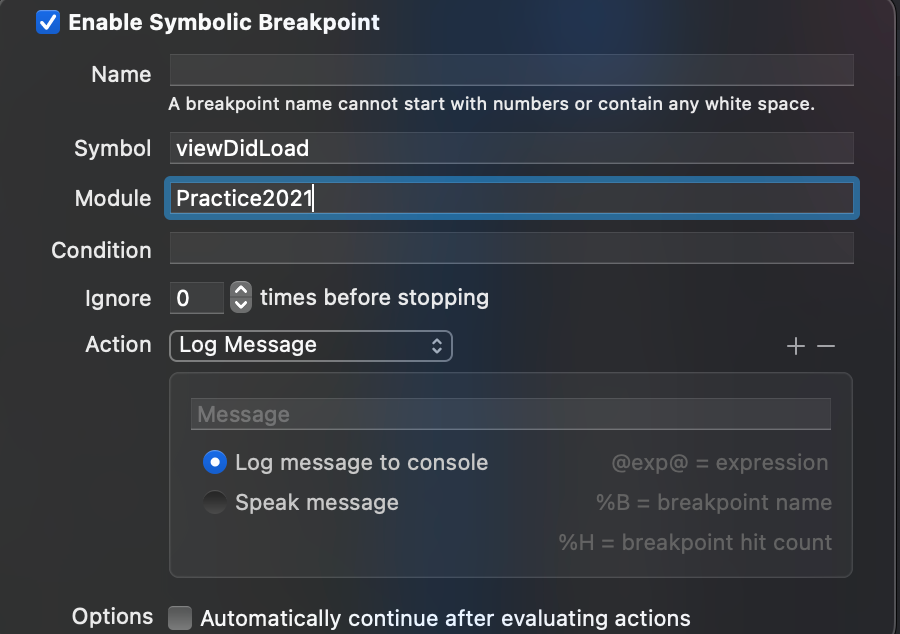
Let's fix it by providing a module name in addition to the symbol for which we want to add a breakpoint.
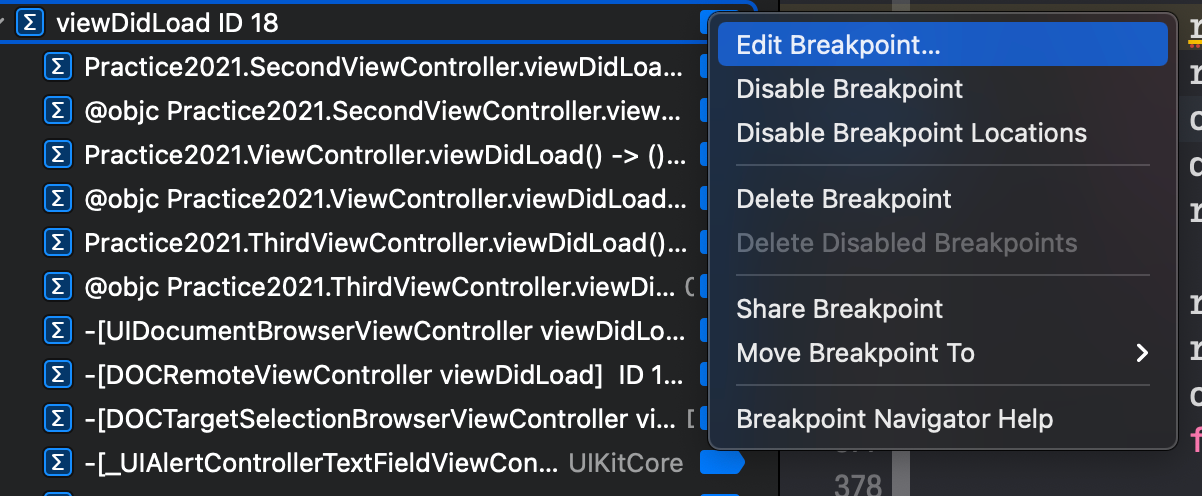
Right-click on the breakpoint and select Edit Breakpoint option. In the new window, under Module, enter the name of your module or library and hit enter
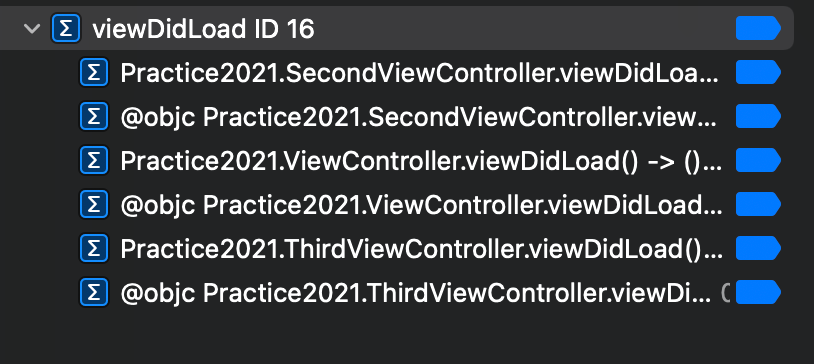
And as you can see in the image below, the number of affected viewDidLoad methods significantly reduced as we applied the module filter.
I would've loved this feature when I was debugging to find the source of place callingviewDidLoadbefore new screen apperaed in the app. The problem was, after I put a symbolic breakpoint onviewDidLoadmethod, it was getting paused on ALL theviewDidLoadmethods in the project. This was annoying. Now, with ability of Xcode to filter symbols based on module name, I can ignore symbols from modules that I don't care about
Fixing Unresolved Breakpoints
In case your breakpoint is not getting hit, Xcode can help you with that. As documented directly in Xcode, there could be multiple reasons why breakpoints may not get hit.
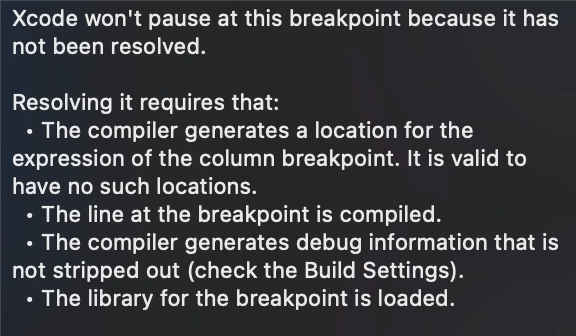
One of the major reasons why breakpoint may not get hit is, the symbolic breakpoint name may be spelled wrong. Since the debugger cannot find the method with that symbol name, the breakpoint will be disabled.
To find out whether function with that name exists or not, or even to find a method whose name closely matches with that symbol name, you can use image lookup utility.
While the debugger is paused, enter the following command in the console,
image lookup -rn remove MyModule
This command performs the lookup into the current module's image. We use r to indicate regex search and n to indicate we are providing a name of potential symbol. In the above command, we are requesting all the method names in MyModule module whose name matches with provided regex expression - In this case, remove.
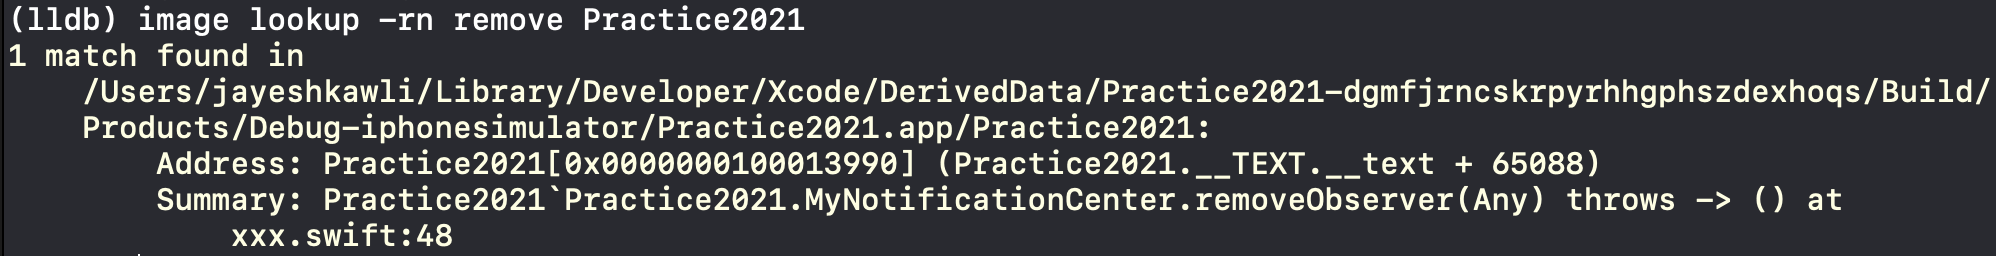
As you can see, there was a method whose name matched with remove in current module. Running this command provides the output that involves all the symbols whose name matches with remove pattern.
Once you have a list of all the functions matching that name, you can inspect whether the function with that name actually exists or you had a typo while creating a symbolic breakpoint.
Enabling Runtime Issues Breakpoint
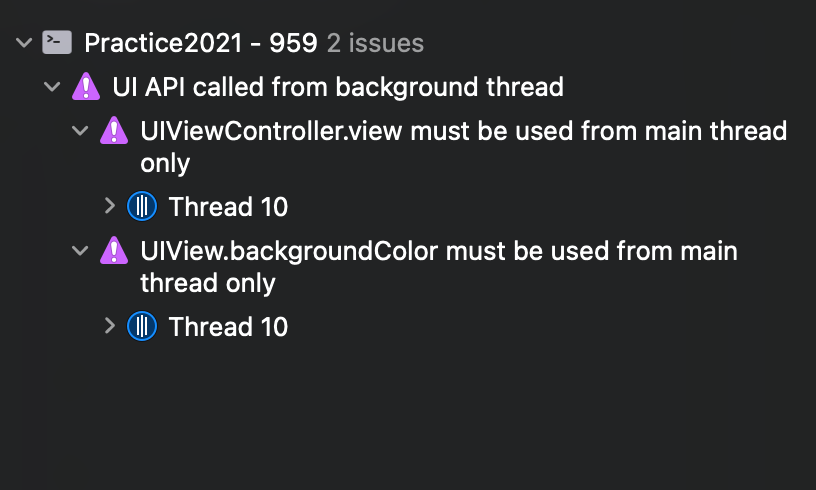
The newly introduced runtime issue breakpoint allows applications to pause when they run into a runtime issue. Usually, when this breakpoint is not enabled, runtime issues are collected and displayed in Xcode's issue navigator tab without pausing the program flow.
Maybe this behavior has the reason for not disrupting developers' flow from their usual activity, but developers may see it long after the issue was detected. If you want the debugger to pause right after the runtime issue is caught, you can enable runtime breakpoints from Breakpoint navigator tab.
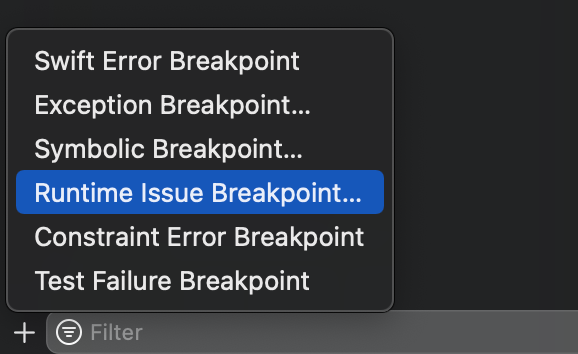
- Click on
+icon in the bottom-left corner - Choose and click
Runtime issue breakpointoption - And that's it. The breakpoint to pause at runtime issues is now set and enabled
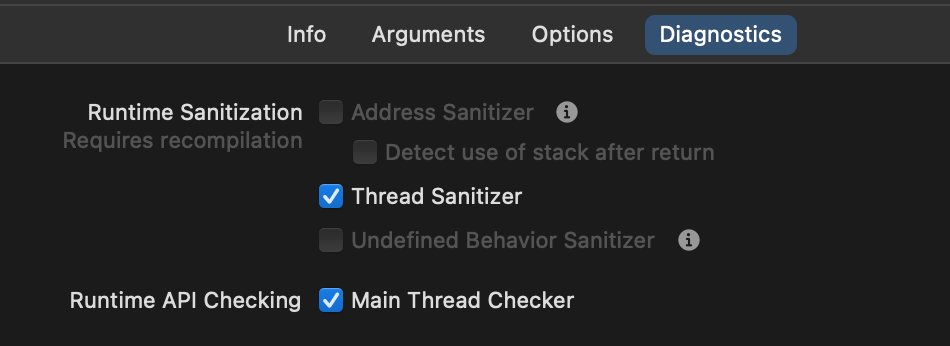
Please note that, in order for the runtime issue breakpoint to pause at a particular issue, you must enable its check from the diagnostics tab. For example, if you want the debugger to pause on the Thread sanitizer issue, you must enable it from the diagnostics tab.
Next, let's write some thread-unsafe code and see how runtime issue breakpoint responds to it,
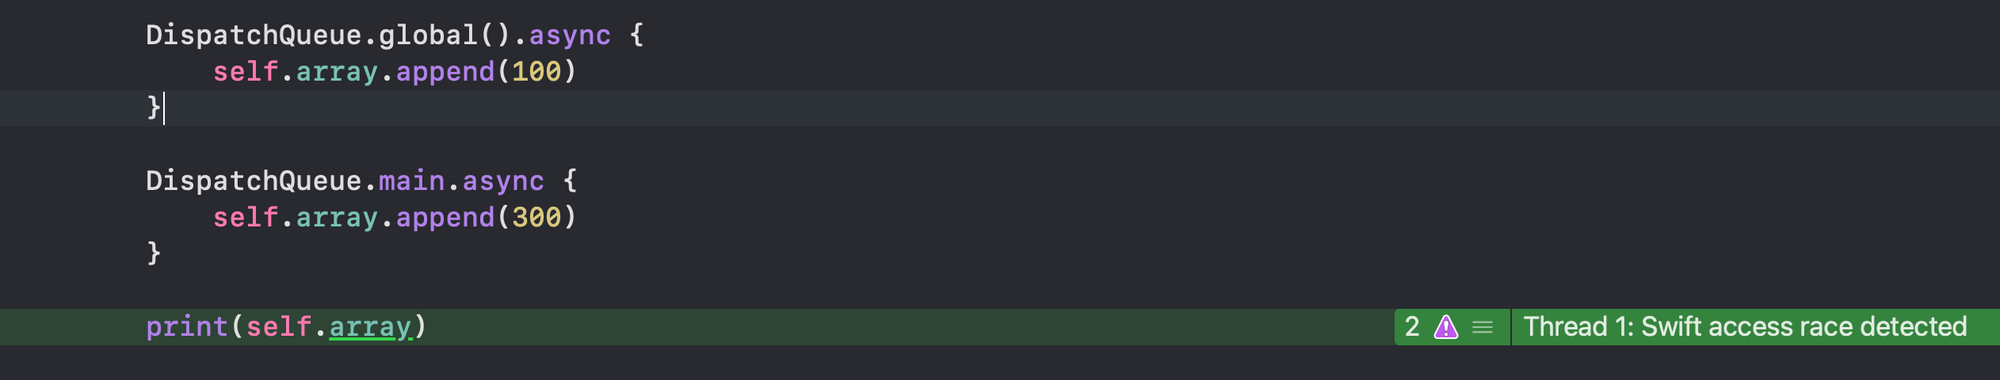
As you can see, the code above is not a thread-safe. The write takes place on both background and main queue and we're also reading from the variable on the last line. Since there is no exact order in which this sequence will execute, it can result in data race conditions and thus be flagged as such by debugger by pausing on that line.
This new breakpoint feature can be useful to immediately detect issues when they first surface instead of letting them go in the Issue navigator and having to look at them a long time after they appeared. Of course, if you feel like disrupted due to continuous pauses, you can manually disable this breakpoint.
Summary
Apple did a great job of introducing these new breakpoint features at the right time. Looking at the list of the new features, I can guarantee that I am going to be frequently using them. These improvements will allow developers to only focus on things that are important to debug as well as shift their focus to places that were ignored earlier - Like the Runtime issue navigator.
Another reason why I liked these new features is, in the past, I have dealt with problems that were easy to solve with these new improvements - Like adding module-level symbolic breakpoints. If they had been introduced earlier, that would've made my life much easier. But nevertheless, this is not the end of my career. I have lot many problems to solve and I see myself using these utilities a lot in the future.
But I would love to hear what you think too. Do you think these new APIs make sense? Are they adding any value? What workaround did you use in the past to solve the problems which are now solved by these APIs? Are there any other improvements I missed in this article? As usual, I welcome your feedback and comments. If you have anything related to share, you can hit me up on Twitter @jayeshkawli.