Histogram Problem - Calculating the total volume of water held

This is another interview problem I came across recently. This is the classic and routine interview question. To summarize, problem can be described as follows,
Given n non-negative integers representing an elevation map where the width of each bar is 1, compute how much water it is able to trap after raining
This problem is a great example of dynamic programming problem. Problem could also be solved with time complexity of O(n^2) (For an input array of size n). However, with dynamic solution, two pass over an array to gather required data and final pass to compute volume of water over individual bar will give a linear solution.
Let's assume our histogram looks like this,
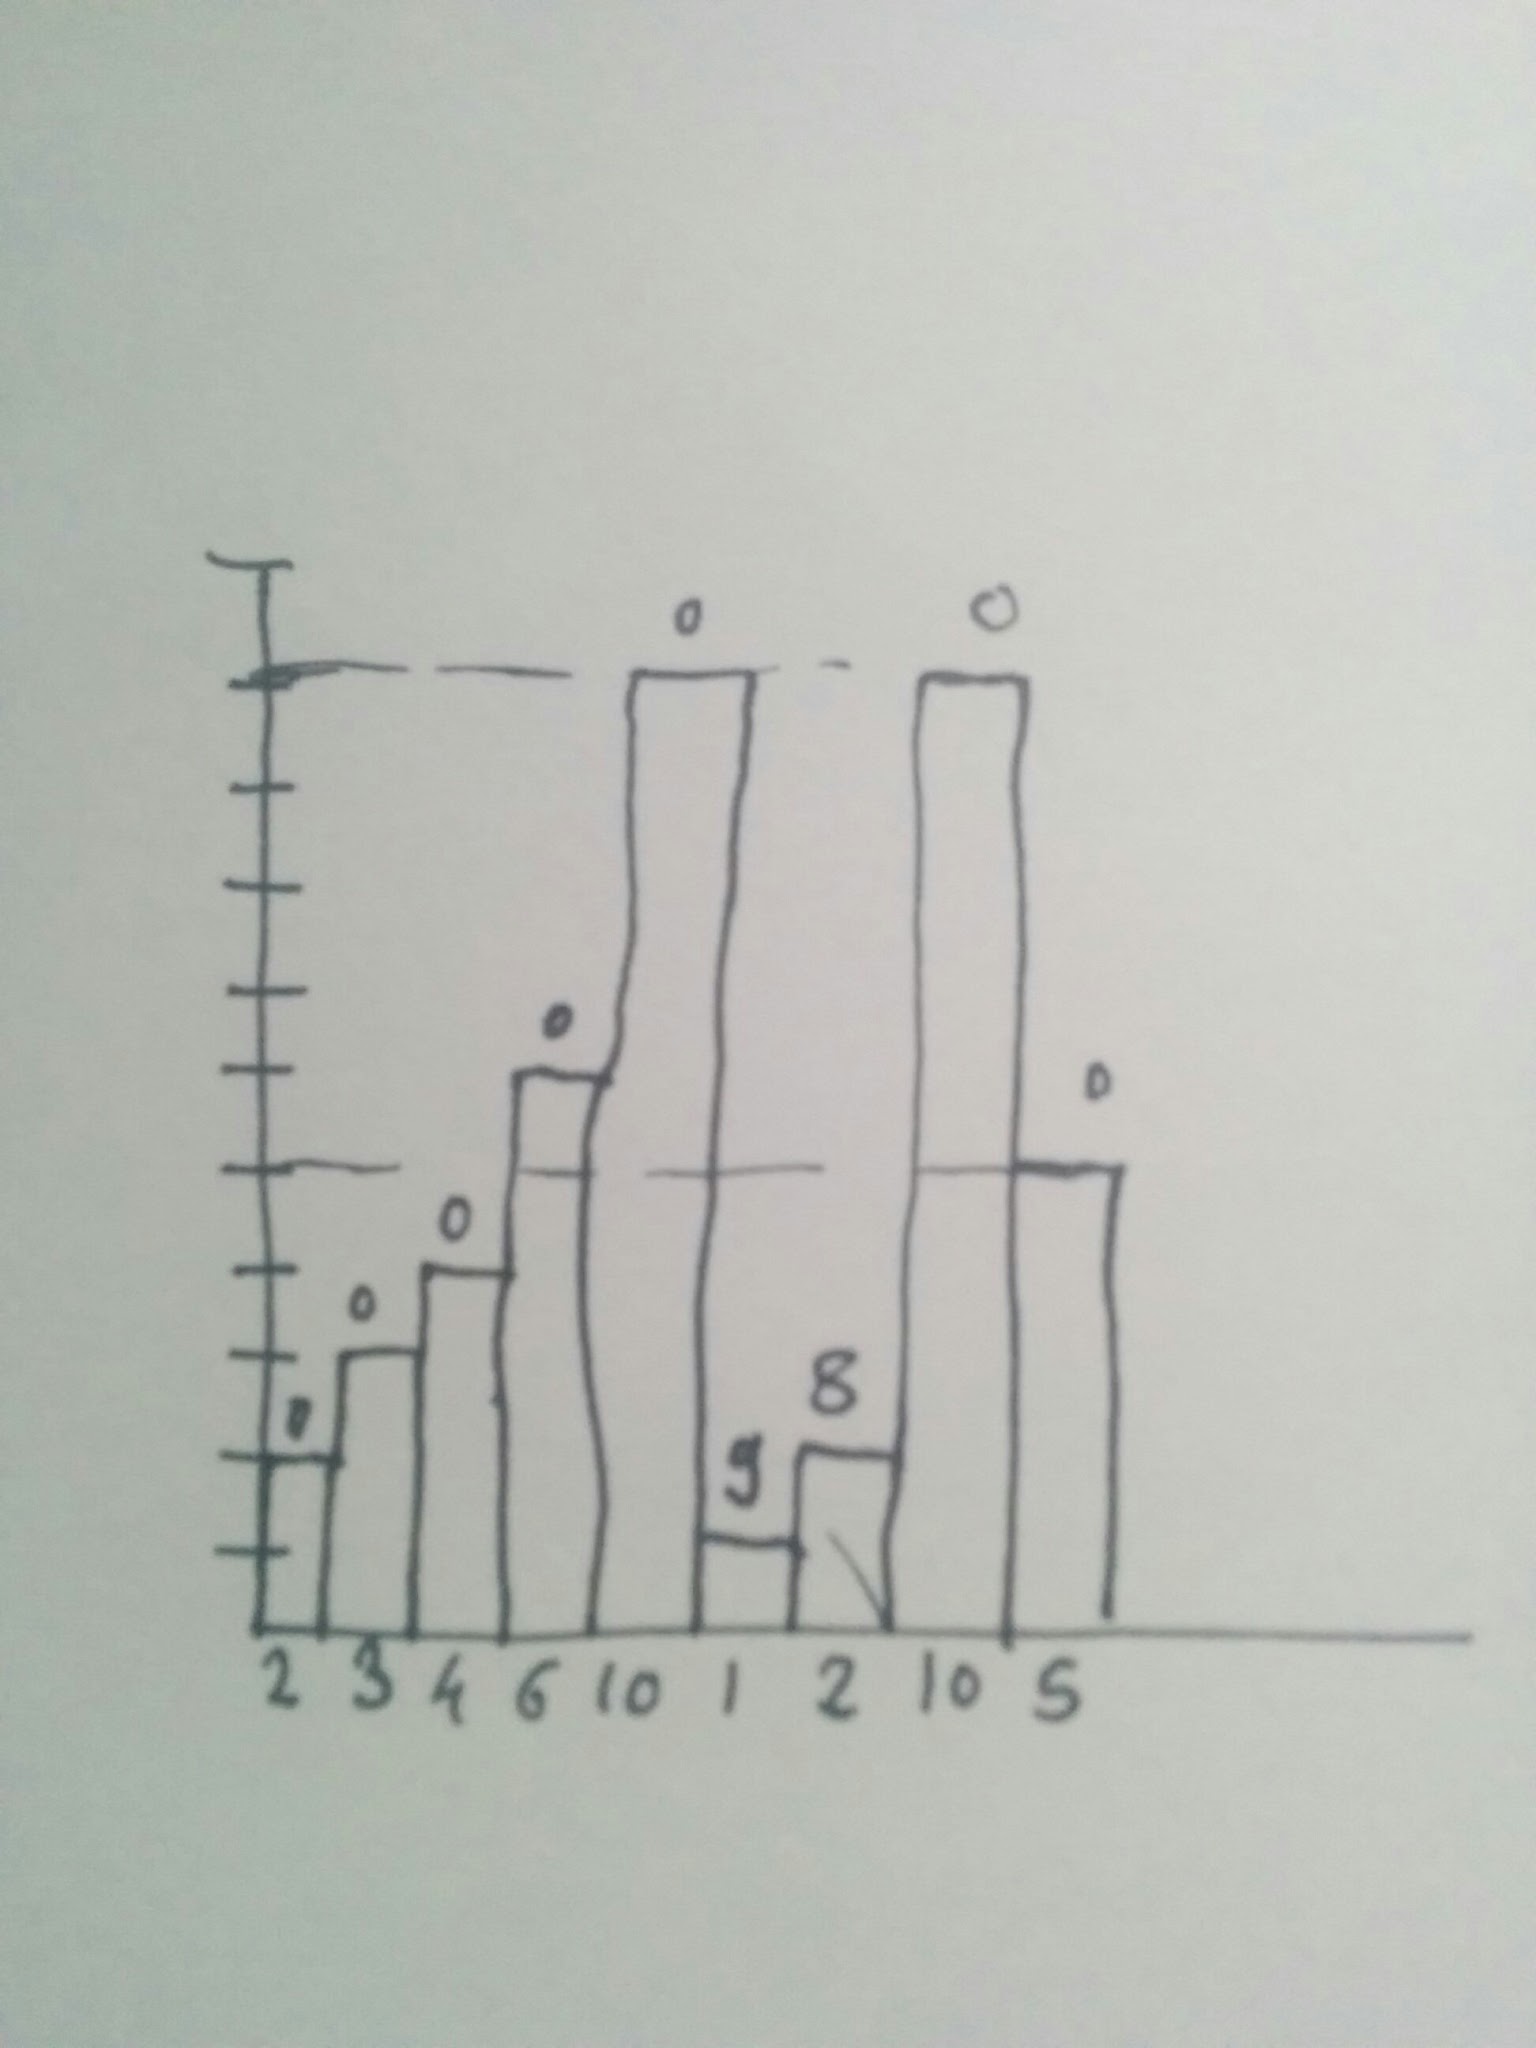
[2, 3, 4, 6, 10, 1, 2, 10, 5] where every positive integer represents the height of histogram bar. This diagram will look like this.
X axis denotes the height of bar and numbers on top indicate the volume held by individual bars
Algorithm:
- Maintain two arrays
leftHighestandrightHighest ith element of theleftHighestarray will store the highest bar to the left ofith bar including itselfith element of therightHighestarray will store the highest bar to the right ofith bar including itself- Iterate over each bar and calculate
min(leftHighest[i], rightHighest[i])forith bar. We calculateminvalue because whatever amount of waterith bar holds will be limited by smallest of the highest bars on both sides. - Subtract the current histogram height from this minimum value. This is because, the histogram at position
ilimits the water that trench can hold by the amount proportional to its height. - Repeat the step 5 for all histogram bars and keep adding the water amount. When we have processed all the histograms, we are done
It is important to note the logic behind step 5. Looking at the image at histogram bar with value
1, the left and right highest values are10on both sides. Which gives usmin(10, 10) = 10. However, volume of water it can hold is limited by its own volume which is1. So amount of water held by histogram bar with height1from above image is
min(10, 10) - 1 = 9
And we can apply the same logic for rest of histogram bars as well
After looking at algorithm, let's move to the implementation
func calculateHistogramArea(with histogramStructure: [Int]) -> Int {

    // Edge case
    if histogramStructure.count < 1 {
        return 0
    }

    // Maintain this two arrays to store left and right highest bars for given histogram bar including itself.
    var rightHighest = Array(repeating: 0, count: histogramStructure.count)
    var leftHighest = Array(repeating: 0, count: histogramStructure.count)

    // Initialize the first value of leftHighest with first bar of input histogram
    leftHighest[0] = histogramStructure[0]

    // Initialize the last value of rightHighest with last bar of input histogram
    rightHighest[rightHighest.count - 1] = histogramStructure[histogramStructure.count - 1]


    // Store the value of highest bar on the left of given bar
    for i in 1..<histogramStructure.count {
        leftHighest[i] = max(leftHighest[i - 1], histogramStructure[i])
    }

    // Store the value of highest bar on the right of given bar
    for i in (0..<histogramStructure.count - 1).reversed() {
        rightHighest[i] = max(rightHighest[i + 1], histogramStructure[i])
    }

    // Now we have list of highest bars on the left and right for individual bars. Compute the volume of water held for each histogram bar.
    var totalWaterVolume = 0
    for i in 0..<histogramStructure.count {
        totalWaterVolume = totalWaterVolume + (min(leftHighest[i], rightHighest[i]) - histogramStructure[i])
    }

    return totalWaterVolume
}

// Usage
var histogramArea = calculateHistogramArea(with: [2, 3, 4, 6, 10, 1, 2, 10, 5])
// histogramArea = 17
To get more understanding of how algorithm works, we will also print the value of leftHighest and rightHighest arrays along with value of totalWaterVolume at the beginning of each iteration
leftHighest = [2, 3, 4, 6, 10, 10, 10, 10, 10]
rightHighest = [10, 10, 10, 10, 10, 10, 10, 10, 5]

totalWaterVolume: (Values)

Iteration 0 : 0

Iteration 1 : 0

Iteration 2 : 0

Iteration 3 : 0

Iteration 4 : 0

Iteration 5 : 0

Iteration 6 : 9

Iteration 7 : 17

Iteration 8 : 17

totalWaterVolume at the end of iterations = 17
Now let's write some unit tests for this implementation.
func testHistogramProblem() {

    let emptyArray: [Int] = []
    let singeElementArray = [10]
    let twoElementsArray = [10, 9]
    let threeElementsArray = [10, 4, 11]
    let randomArray = [0, 1, 0, 2, 1, 0, 1, 3, 2, 1, 2, 1]
    let additionalArray = [6, 3, 4, 9, 1, 10]

    XCTAssertEqual(calculateHistogramArea(with: emptyArray), 0)
    XCTAssertEqual(calculateHistogramArea(with: singeElementArray), 0)
    XCTAssertEqual(calculateHistogramArea(with: twoElementsArray), 0)
    XCTAssertEqual(calculateHistogramArea(with: threeElementsArray), 6)
    XCTAssertEqual(calculateHistogramArea(with: randomArray), 6)
    XCTAssertEqual(calculateHistogramArea(with: additionalArray), 13)
}
Time Complexity
We make three passes over an array of size, say n. First pass to get highest histogram value to the left of individual bar. Second pass to get highest value to the right of each histogram bar and third one to compute volume of water for every bar. Which makes it O(3n) in terms of Big O notation. By the rule it eventually becomes O(n) - A linear solution.
Reference:
GeeksForGeeks - Trapping Rain Water